Break-Even Point — Formula, Calculation & Business Examples
Break-even analysis is one of the most fundamental tools in business finance — it tells you exactly how many units you must sell, or what revenue you must generate, before your business stops losing money and starts making profit. Whether you’re launching a new product, evaluating a price change, or planning a new business, break-even analysis provides a clear quantitative answer to the question: “When do we start making money?”
This guide covers the break-even formula, contribution margin, BEP in units vs revenue, margin of safety, and worked examples across product businesses and service businesses in the Indian context.
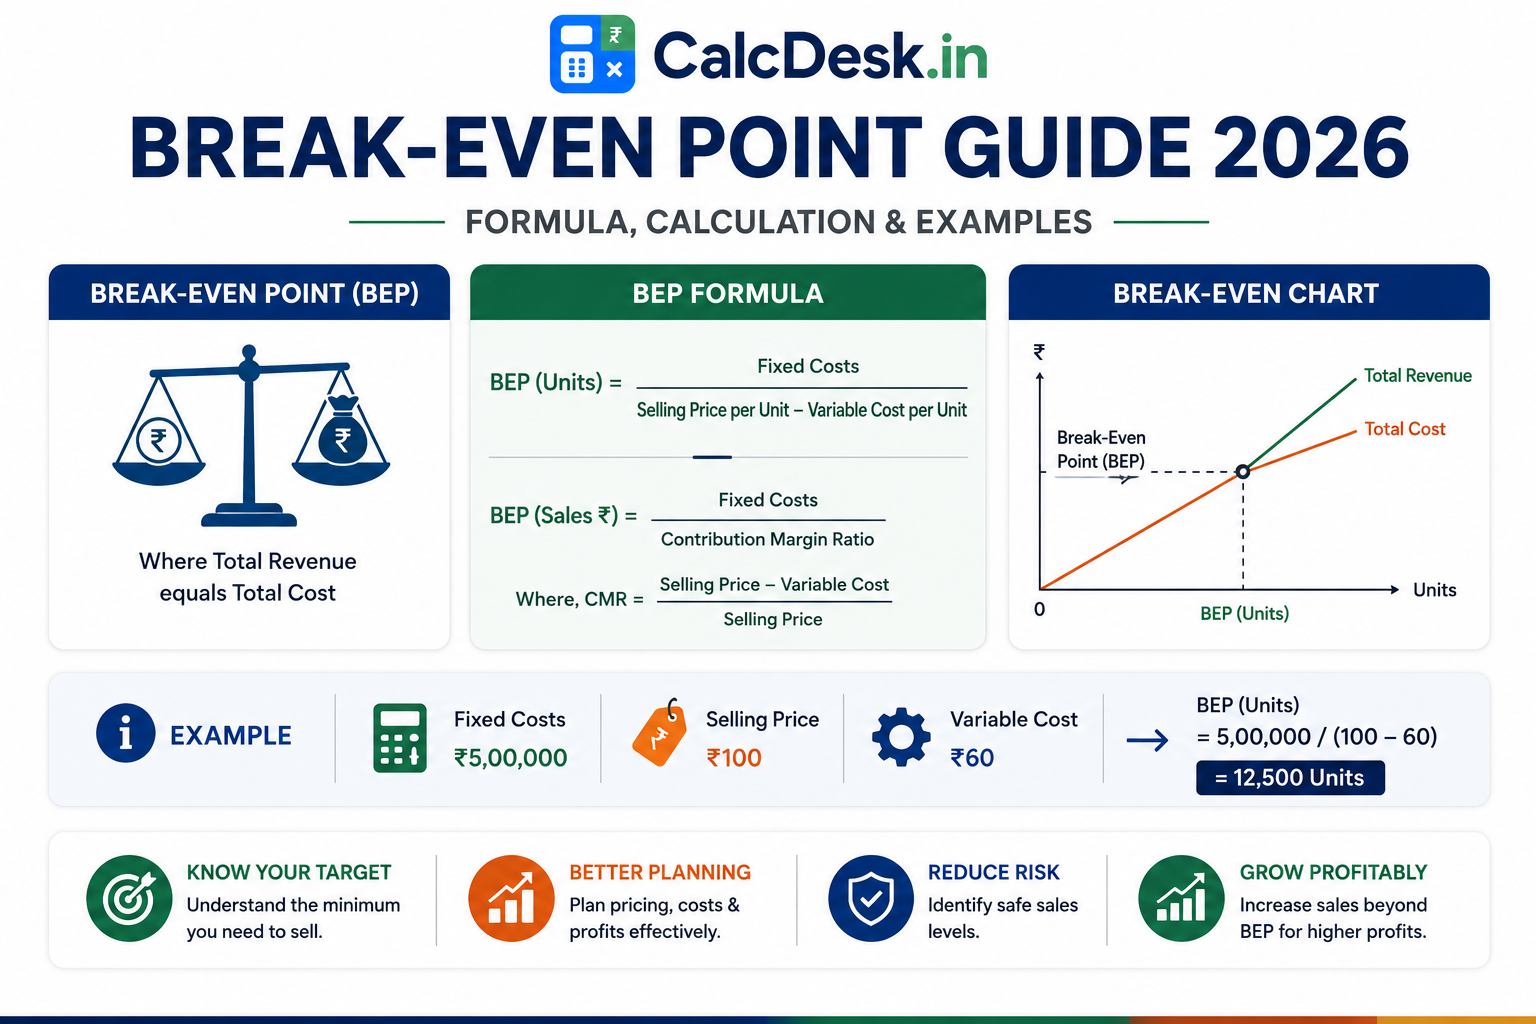
The Break-Even Formula
Break-Even Point Formulas
where: Contribution Margin = Selling Price − Variable Cost per Unit
BEP (Revenue) = Fixed Costs ÷ Contribution Margin Ratio
where: CM Ratio = (Selling Price − Variable Cost) ÷ Selling Price
Margin of Safety = Actual Sales − Break-Even Sales
Margin of Safety % = (Actual Sales − BEP) ÷ Actual Sales × 100
Key Concepts — Fixed vs Variable Costs
| Cost Type | Definition | Examples |
|---|---|---|
| Fixed Costs | Don’t change with output volume | Rent, salaries, loan EMIs, insurance, software subscriptions |
| Variable Costs | Change proportionally with output | Raw materials, packaging, sales commission, delivery charges, GST on inputs |
| Semi-Variable | Fixed component + variable component | Electricity (fixed minimum + per-unit consumption), phone bills |
Worked Example 1 — Manufacturing Business
Garment manufacturer — T-shirt business
Fixed costs (monthly): Rent ₹50,000 + Salaries ₹1,50,000 + Machinery EMI ₹30,000 = ₹2,30,000
Selling price per T-shirt: ₹450 | Variable cost per T-shirt: ₹250 (fabric + labour + packaging)
Contribution Margin per unit: ₹450 − ₹250 = ₹200
BEP (Units) = ₹2,30,000 ÷ ₹200 = 1,150 T-shirts/month
BEP (Revenue) = 1,150 × ₹450 = ₹5,17,500/month
Current production: 1,800 units/month → Profit = (1,800 − 1,150) × ₹200 = ₹1,30,000/month
Worked Example 2 — Service Business (Coaching Institute)
Online coaching institute — monthly subscription model
Fixed costs: Faculty salaries ₹3,00,000 + Platform cost ₹50,000 + Marketing ₹1,00,000 = ₹4,50,000
Subscription price: ₹3,000/month per student | Variable cost per student: ₹500 (content creation, support)
Contribution Margin: ₹3,000 − ₹500 = ₹2,500 per student
BEP = ₹4,50,000 ÷ ₹2,500 = 180 students
Current students: 250 → Monthly profit = (250 − 180) × ₹2,500 = ₹1,75,000
Worked Example 3 — Impact of Price Change on BEP
Same garment business — evaluating a 10% price cut to gain market share
New selling price: ₹405 (10% cut from ₹450)
Variable cost unchanged: ₹250 | New CM per unit: ₹405 − ₹250 = ₹155
New BEP = ₹2,30,000 ÷ ₹155 = 1,484 units/month (up from 1,150)
The 10% price cut increases BEP by 29% — business needs 334 additional units just to break even
Decision: Only cut price if confident of selling at least 1,484 units — otherwise it destroys profitability
Margin of Safety — How Much Buffer Do You Have?
Garment business: Current sales 1,800 units, BEP 1,150 units
Margin of Safety (units) = 1,800 − 1,150 = 650 units
Margin of Safety % = 650 ÷ 1,800 × 100 = 36.1%
Sales can drop by 36% before losses begin — a healthy buffer for seasonal businesses
After price cut (BEP 1,484): MoS = (1,800 − 1,484) ÷ 1,800 = 17.6% — buffer more than halved
Multi-Product Break-Even (Weighted Average CM)
For businesses with multiple products, calculate break-even using the weighted average contribution margin ratio:
- Calculate CM ratio for each product
- Weight by that product’s share of total sales
- Weighted Average CM Ratio = Σ (CM Ratio × Sales Mix %)
- BEP Revenue = Total Fixed Costs ÷ Weighted Average CM Ratio
💡 Practical tip: Break-even is a planning tool, not a goal. The goal is maximising profit above break-even. Use BEP analysis to set minimum viable sales targets, evaluate pricing changes, assess new product viability, and determine how much you can cut prices in competitive situations before crossing into loss territory.
🏢 Free Business Financial Calculators — CalcDesk
Explore our full suite of business and investment calculators.
→ Explore All CalculatorsRelated Calculators & Articles
Frequently Asked Questions
Break-Even Analysis for Service Businesses
Service businesses often struggle with break-even analysis because their “units” are less clearly defined than product businesses. Here’s how to adapt the framework:
Approach 1 — Revenue-Based BEP (Recommended for Services)
Service Business BEP Formula
CM Ratio = (Revenue – Variable Costs) / Revenue
Example: IT services firm
Fixed costs: Rs.15L/month (office, salaries, software)
Variable costs: 25% of revenue (subcontractors, travel, tools)
CM Ratio: 1 – 0.25 = 0.75
BEP Revenue = Rs.15L / 0.75 = Rs.20L/month minimum revenue to break even
Approach 2 — Billable Hours BEP
Consulting/Agency BEP Using Billable Hours
Fixed costs: ₹8L/month | Billing rate: ₹2,500/hour | Variable cost per hour: ₹500 (software, travel)
Contribution per hour: ₹2,500 − ₹500 = ₹2,000
BEP = ₹8,00,000 / ₹2,000 = 400 billable hours/month
With 4 consultants: each needs 100 billable hours/month (≈ 23 hours/week at 80% utilisation)
This tells you exactly what billable utilisation rate you need to break even
Using BEP for Startup Runway Planning
For startups, BEP analysis is critical for investor conversations and burn rate management:
- Months to BEP: If current monthly revenue is ₹5L and BEP is ₹20L, and revenue grows 15% monthly, BEP is approximately 10 months away — plan funding accordingly
- Cash runway: If current cash is ₹60L and monthly burn (fixed costs − current revenue) is ₹8L, you have 7.5 months of runway. Reaching BEP before runway ends is the fundamental startup survival equation
- Sensitivity analysis: What if revenue growth is only 10% instead of 15%? BEP moves out to 13 months — exceeding the 7.5-month runway. This reveals fundraising urgency
💡 BEP and pricing strategy: Many startups underprice to acquire customers, inadvertently pushing their BEP to an unreachable level. Before setting prices, calculate what price allows you to break even within a reasonable timeframe at realistic volume assumptions. Underpricing is not a customer acquisition strategy — it’s a path to permanent losses.