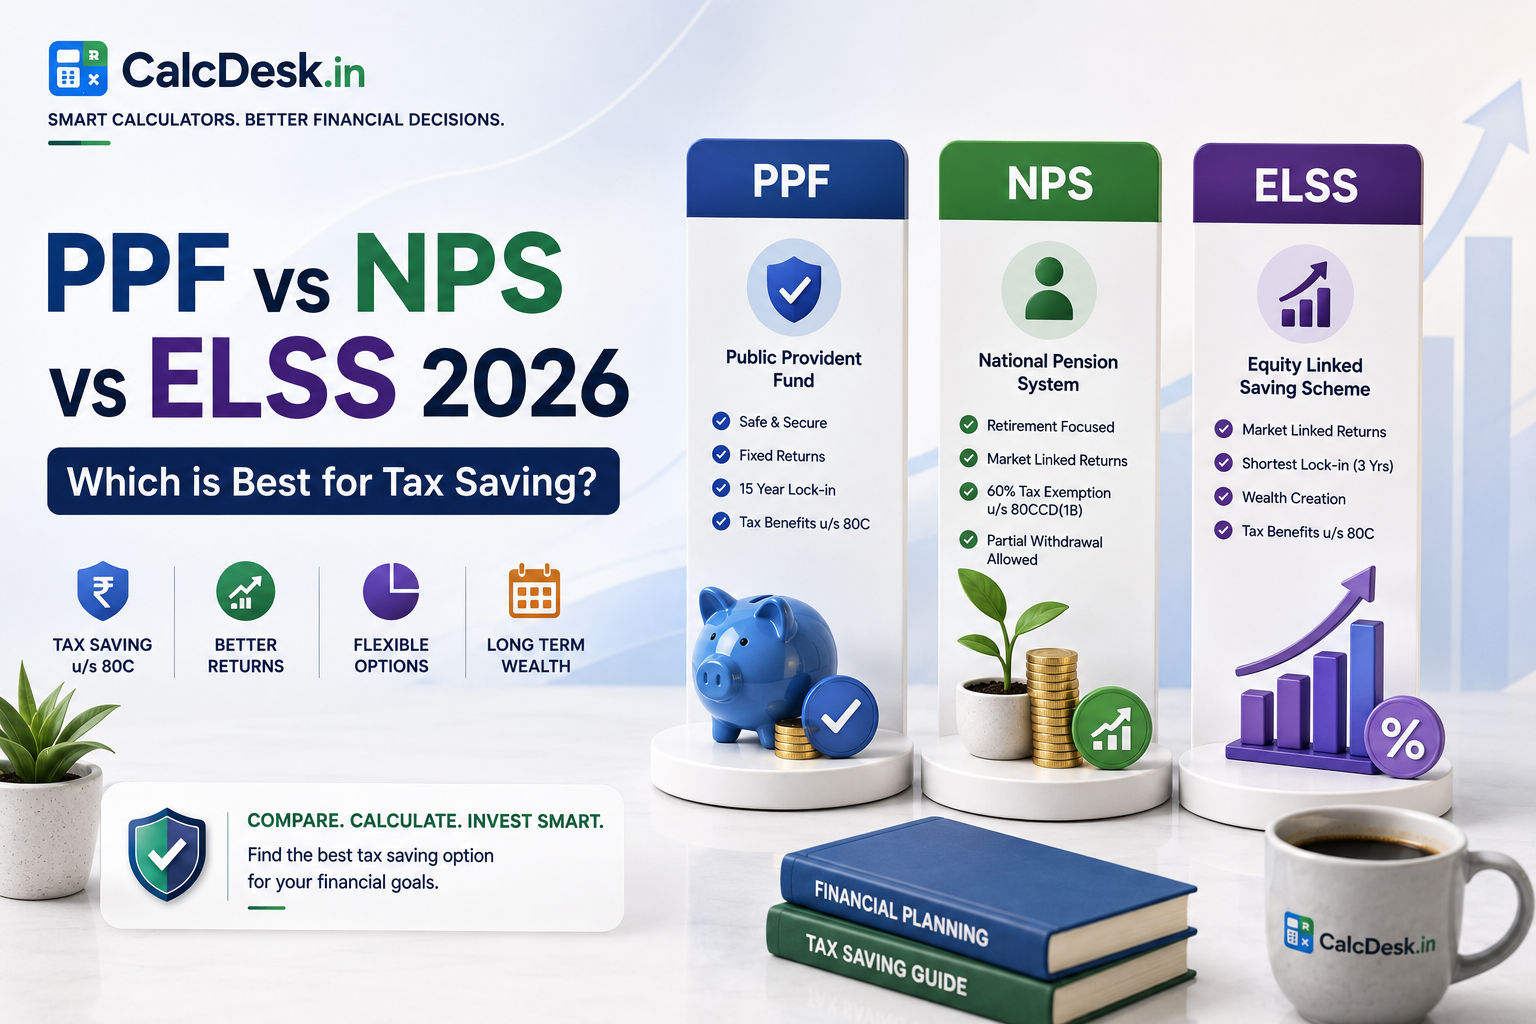
PPF vs NPS vs ELSS 2026 — Complete Comparison for Tax Saving
PPF, NPS, and ELSS are the three most popular Section 80C investments for Indian salaried taxpayers — and they’re fundamentally different instruments. PPF offers guaranteed tax-free returns with government backing. NPS provides market-linked retirement savings with an exclusive extra ₹50,000 deduction. ELSS delivers equity market returns with the shortest 3-year lock-in among all 80C options. Choosing between them — or combining them intelligently — depends on your age, risk tolerance, and financial goals.
This guide provides a comprehensive comparison across returns, taxation, lock-in, liquidity, and the right allocation strategy for different investor profiles. Use CalcDesk’s SIP Calculator to model ELSS SIP returns and the PPF Guide for guaranteed corpus projections.
PPF vs NPS vs ELSS — Complete Comparison
| Feature | PPF | NPS Tier 1 | ELSS |
|---|---|---|---|
| Returns | 7.1% (guaranteed, tax-free) | 10-12% (equity allocation, market-linked) | 12-15% CAGR (historical, not guaranteed) |
| Risk | Zero (government backed) | Low to High (depends on allocation) | High (pure equity) |
| Lock-in | 15 years | Until age 60 | 3 years per investment |
| Sec 80C Limit | Up to ₹1.5 lakh | Within ₹1.5L (80CCD(1)) | Up to ₹1.5 lakh |
| Extra Deduction | None | +₹50,000 (Sec 80CCD(1B)) | None |
| Tax on Returns | Tax-free (EEE) | 60% tax-free; 40% annuity taxable | LTCG 12.5% above ₹1.25L/year |
| Partial Withdrawal | From year 7 (partial) | Limited after 3 years (specific purposes) | Anytime after 3-year lock-in |
| Best For | Conservative, guaranteed corpus | Retirement, extra tax saving | Aggressive, equity growth, shorter horizon |
Worked Example 1 — ₹1.5 Lakh Invested in Each (15 Years)
₹1,50,000/year for 15 years — PPF vs ELSS vs NPS
PPF (7.1% guaranteed): Corpus ≈ ₹40.5 lakh — fully tax-free on withdrawal
NPS (11% blended return, 75% equity): Corpus ≈ ₹51.6 lakh
At maturity: 60% (₹30.9L) tax-free; 40% (₹20.7L) must buy annuity → ~₹1.38L/month pension (taxable)
ELSS (13% CAGR — historical equity average): Corpus ≈ ₹59.3 lakh
Tax: LTCG 12.5% on gains above ₹1.25L — effective post-tax corpus ~₹53-55 lakh depending on withdrawal year
Worked Example 2 — Tax Saving Comparison (₹15L income, 30% bracket)
Optimising tax deductions — PPF + NPS + ELSS combo
Invest ₹50,000 in PPF + ₹50,000 in ELSS + ₹50,000 in NPS Tier 1 = ₹1,50,000 (exhausts Sec 80C)
Additionally invest ₹50,000 in NPS Tier 1 under Sec 80CCD(1B) = extra ₹50,000 deduction
Total deduction: ₹2,00,000 | Tax saved (30% slab + cess): ₹2,00,000 × 31.2% = ₹62,400/year
Without NPS Sec 80CCD(1B): deduction would be only ₹1,50,000 → tax saved ₹46,800 → ₹15,600 less
Worked Example 3 — ELSS SIP for Wealth with Tax Saving
₹12,500/month ELSS SIP (₹1.5L/year) for 10 years at 13% CAGR
Total invested: ₹15,00,000 | Estimated corpus: ≈ ₹28.9 lakh
LTCG tax estimate (gains ₹13.9L, exemption ₹1.25L/year with staggered withdrawal): minimal, typically ₹1-2L total
Annual tax saving (30% bracket): ₹1,50,000 × 31.2% = ₹46,800/year → ₹4,68,000 saved over 10 years
Effective net corpus after tax saving factor: very attractive for aggressive investors under 45
Who Should Choose What?
| Investor Profile | Recommended Allocation |
|---|---|
| Under 30, high risk appetite | 70% ELSS + 30% NPS (for ₹50K extra deduction) |
| 30-45, balanced | 40% ELSS + 30% PPF + 30% NPS Tier 1 |
| 45-55, conservative | 50% PPF + 30% NPS + 20% ELSS |
| 55+, near retirement | 60% PPF/FD + 40% NPS (for annuity) |
| Government employee | Max PPF + NPS Tier 2 (flexible) + ELSS for growth |
📌 Best strategy for most salaried Indians: Max out NPS Tier 1 for the ₹50,000 Sec 80CCD(1B) deduction (this alone saves ₹15,600/year at 30% slab). Then split the remaining ₹1,50,000 Sec 80C between ELSS (for growth) and PPF (for safety). This creates three layers: guaranteed safe corpus (PPF), market-linked retirement corpus (NPS), and liquid equity wealth (ELSS).
📊 Calculate Your Investment Growth — Free
SIP calculator, CAGR calculator, and NPS calculator all free on CalcDesk.
→ Explore All CalculatorsRelated Calculators & Articles
The ₹1.5 Lakh 80C Decision Tree
For FY 2026-27, here is a structured decision process to allocate your ₹1.5 lakh Section 80C limit optimally. Note: Section 80C deductions are only relevant under the Old Tax Regime. If you are in the New Regime, skip this entirely — your money has full flexibility and no lock-in constraints.
New Regime users — stop here: If you have opted for the New Tax Regime in FY 2026-27, Section 80C does not apply. There is no benefit to locking money in PPF or ELSS for tax saving. Invest in regular mutual funds (direct plans) with full liquidity and no lock-in. The New Regime’s zero tax up to ₹12.75 lakh makes 80C-driven investment decisions obsolete for most salaried employees at lower income levels.
For Old Regime users — follow this decision flow:
- Is your EPF contribution (employee + employer’s 12% of basic) already ₹1.5 lakh or more? → 80C limit is exhausted. No further 80C investment needed. Choose any investment purely for returns with no tax-driven lock-in constraints (regular mutual funds, FD without 80C consideration).
- EPF contribution less than ₹1.5 lakh? → Calculate the gap: ₹1.5L − EPF = amount to invest in other 80C instruments.
- Time horizon for the remaining gap is less than 3 years? → Avoid ELSS (3-year lock-in). Consider PPF (partial withdrawal from Year 7, but also allows loan from Year 3). NSC (5-year lock-in but at least you know the maturity date). Tax-saver FD (5-year lock-in) if you want simplicity.
- Time horizon 3–7 years, moderate risk tolerance? → PPF (safe, 7.1% tax-free return) is appropriate. NPS Tier 1 if you specifically want an extra ₹50,000 deduction under Sec 80CCD(1B) beyond the ₹1.5L cap.
- Time horizon 7+ years, comfortable with equity volatility? → ELSS is the optimal choice within 80C — 3-year lock-in (shortest among all 80C options), equity returns historically 12–15% CAGR, and after the lock-in you have full flexibility.
- Age above 50? → Reduce ELSS exposure. A 3-year lock-in means you may be forced to redeem during a bear market close to retirement. Prefer PPF for its capital safety guarantee.
ELSS vs Regular Equity Mutual Fund — Is the Lock-In Worth It?
A common question: if ELSS and a regular equity mutual fund invest in similar stocks, why choose ELSS and accept the 3-year lock-in?
| Feature | ELSS Fund | Regular Equity Mutual Fund |
|---|---|---|
| Section 80C benefit | Yes — up to ₹1.5 lakh per year | No |
| Lock-in | 3 years mandatory per investment | None — fully liquid |
| Tax on gains after 1 year | LTCG 12.5% above ₹1.25L/year | Same — LTCG 12.5% above ₹1.25L/year |
| Fund category returns (5-yr) | 15–18% CAGR (more mid-cap exposure) | Large-cap: 12–14% CAGR typically |
| Flexibility for emergencies | Cannot redeem during 3-year lock-in | Can redeem anytime (1-3 day settlement) |
| Ideal use case | Filing 80C gap in Old Regime | Any goal-based investment, any regime |
When ELSS clearly wins: You need to fill the 80C limit and have a 7+ year investment horizon. The 30% bracket taxpayer saves ₹46,800/year in tax on ₹1.5L investment — this tax saving effectively boosts returns significantly in the first year.
When regular MF is better: Your EPF already exhausts 80C (no benefit left from ELSS). You are in the New Regime (80C doesn’t apply). You need liquidity within 3 years. You want to invest beyond the ₹1.5L 80C cap — that excess has no tax-saving benefit from ELSS anyway.
Practical allocation for an Old Regime taxpayer: If your EPF covers ₹75,000 of 80C, the remaining ₹75,000 gap is best filled with ELSS (via monthly SIP of ₹6,250) if your horizon is 7+ years and risk tolerance is moderate-high. For any additional investment beyond the 80C cap, use regular equity direct plan mutual funds with no lock-in. Do not invest in ELSS beyond the 80C cap — there is no tax benefit and you accept lock-in for nothing.
Frequently Asked Questions
Real Numbers — 20-Year Scenario Comparison
Let’s run a concrete 20-year comparison using ₹1.5 lakh per year (maxing the 80C limit) across all three instruments:
| Metric | PPF (7.1%) | NPS (11% blended) | ELSS (13% CAGR) |
|---|---|---|---|
| Total Invested | ₹30,00,000 | ₹30,00,000 | ₹30,00,000 |
| Gross Corpus at 20 years | ₹65.8 lakh | ₹1,09.5 lakh | ₹1,41.6 lakh |
| Tax on Withdrawal | Zero (EEE) | 40% compulsory annuity (taxable as income) | LTCG 12.5% on gains above ₹1.25L/year |
| Effective Post-Tax Corpus | ₹65.8 lakh | ~₹85-90 lakh (60% tax-free + annuity value) | ~₹1.30-1.35 lakh crore (after LTCG) |
| Annual Tax Saving (30% bracket) | ₹46,800/year | ₹46,800/year (within 80C) | ₹46,800/year (within 80C) |
| Additional Tax Saving (80CCD(1B)) | None | ₹15,600/year extra (₹50K × 31.2%) | None |
Combining all three optimally — ₹50,000 in NPS (for the exclusive 80CCD(1B) deduction) + ₹50,000 in PPF (safe floor) + ₹50,000 in ELSS (equity growth) — exhausts the ₹1.5L limit while diversifying across safety, growth, and tax efficiency simultaneously.
When ELSS Might Disappoint — Managing Equity Risk
ELSS returns of 12-15% are historical averages, not guarantees. There have been significant periods where ELSS funds delivered poor returns:
- FY 2008-09: Large-cap funds fell 50%+ — ELSS investors who redeemed at 3-year lock-in expiry in 2011 saw negative or near-zero returns
- FY 2019-20: Many mid/small-cap oriented ELSS funds fell 30-40% during COVID crash
- Mitigation: Use ELSS via SIP (not lump sum at year-end), hold beyond the mandatory 3 years, and don’t time redemptions to market peaks
📌 Bottom line: PPF is your financial safety net — guaranteed, tax-free, government-backed. NPS is your exclusive extra tax deduction — no other instrument offers ₹50,000 beyond the ₹1.5L cap. ELSS is your growth engine — equity returns over long horizons with 3-year liquidity. All three together create the optimal tax-saving, wealth-building portfolio structure for Indian salaried investors.
Choosing the Right ELSS Fund
Not all ELSS funds are equal. Key selection criteria:
- Consistent 5-year and 10-year CAGR: Look for funds that have beaten their benchmark (typically Nifty 500 or BSE 500) consistently across multiple market cycles, not just in a single bull run
- Fund manager track record: ELSS is actively managed — the fund manager’s consistency matters. Research how the fund performed under the same manager across different market conditions
- Expense ratio: Direct plans have lower expense ratios (0.5-1%) vs regular plans (1.5-2%). Over 20 years, this difference compounds significantly. Always invest in Direct plans via platforms like Groww, Zerodha Coin, or Kuvera
- Portfolio concentration: Some ELSS funds concentrate 40-50% in top 5 stocks — higher risk. Others are more diversified across 50-80 stocks — more stable. Match to your risk tolerance
- AUM size: Very large AUM (above ₹20,000-30,000 crore) can hamper mid/small-cap exposure and flexibility. Very small AUM creates liquidity risk