Power of Compounding — How Small Investments Create Huge Wealth
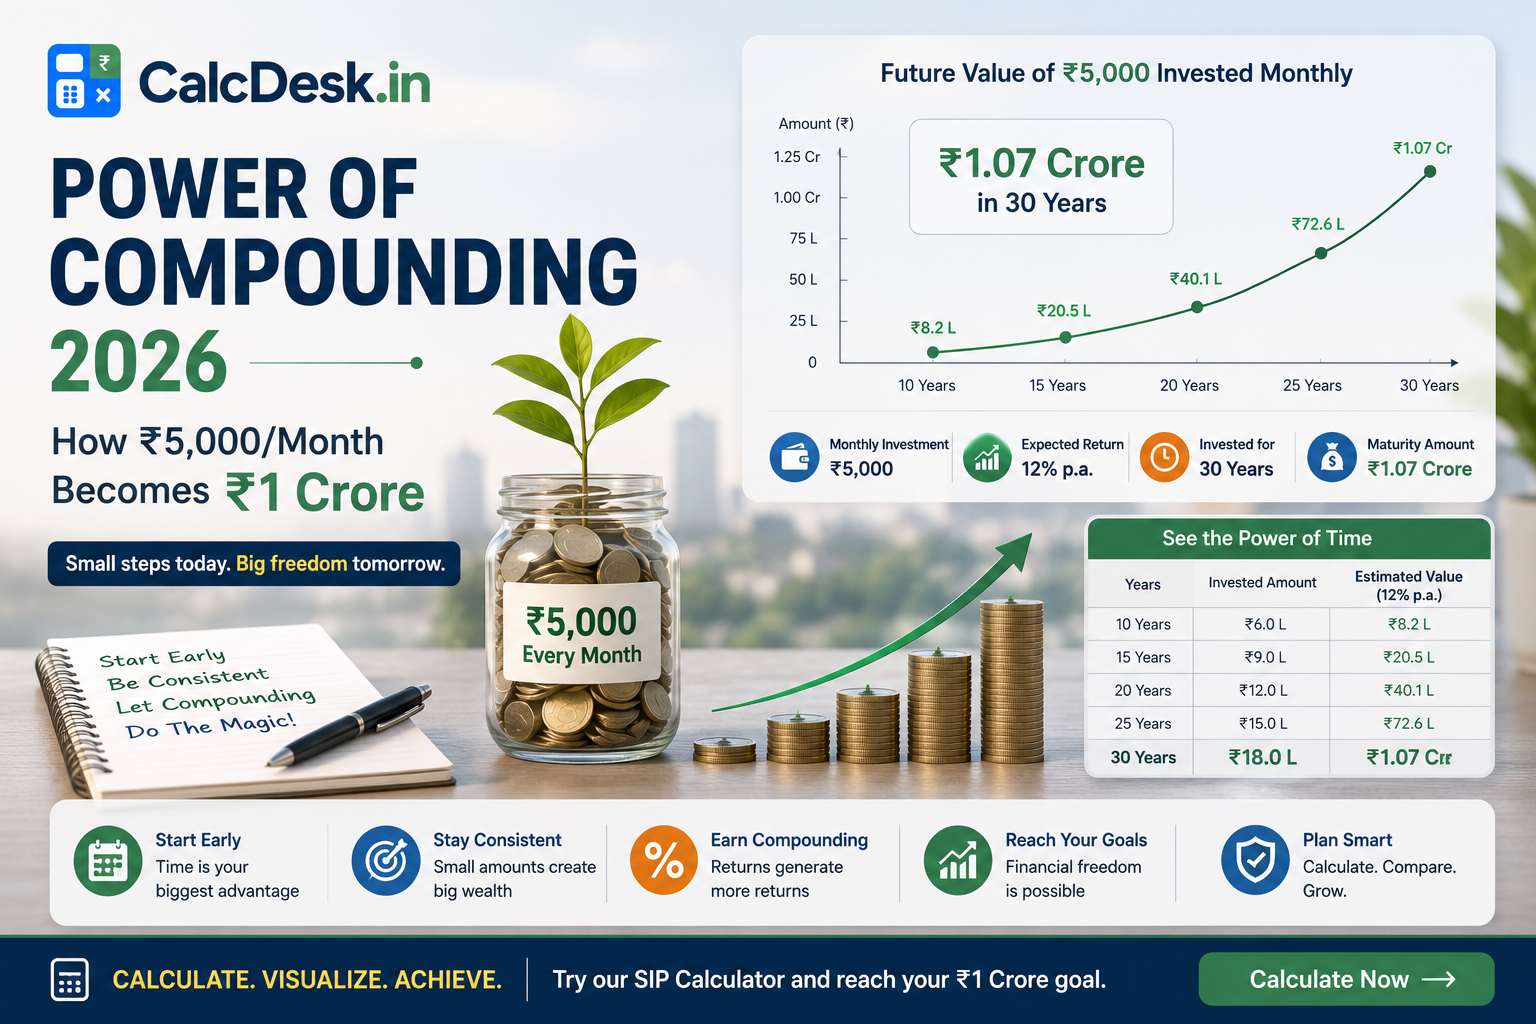
Albert Einstein reportedly called compound interest “the eighth wonder of the world.” Whether or not he said it, the mathematics is undeniable: small, regular investments compounded over decades create extraordinary wealth. A ₹5,000 monthly SIP at 12% CAGR for 30 years grows to ₹1.76 crore — from just ₹18 lakh invested. The other ₹1.58 crore is pure compounding. This guide explains the mechanics with real numbers and shows why starting early is the single most powerful financial decision you can make.
Simple Interest vs Compound Interest — The Core Difference
Simple vs Compound Interest
Compound Interest: A = P × (1 + r)^n
Rs.1,00,000 at 12% for 30 years:
Simple Interest: Rs.1,00,000 + (Rs.1,00,000 × 12% × 30) = Rs.4,60,000
Compound Interest: Rs.1,00,000 × (1.12)^30 = Rs.29,96,000
Compounding creates Rs.25,36,000 MORE wealth from the same investment
The Exponential Growth Chart — Where Compounding Explodes
| Year | Value of ₹1,00,000 at 12% CAGR | Total Gain |
|---|---|---|
| 5 years | ₹1,76,234 | ₹76,234 |
| 10 years | ₹3,10,585 | ₹2,10,585 |
| 15 years | ₹5,47,357 | ₹4,47,357 |
| 20 years | ₹9,64,629 | ₹8,64,629 |
| 25 years | ₹17,00,006 | ₹16,00,006 |
| 30 years | ₹29,95,992 | ₹28,95,992 |
Notice how the gain between year 20 and 30 (₹20.3 lakh) is far larger than the gain between year 0 and year 20 (₹8.6 lakh). This is compounding’s signature — slow start, explosive finish.
Worked Example 1 — ₹5,000/Month SIP for Different Durations
₹5,000/month SIP at 12% CAGR — impact of time
10 years: Invested ₹6L → Corpus ≈ ₹11.6L (₹5.6L from compounding)
20 years: Invested ₹12L → Corpus ≈ ₹49.9L (₹37.9L from compounding)
30 years: Invested ₹18L → Corpus ≈ ₹1.76 crore (₹1.58 crore from compounding)
Going from 20 to 30 years: extra ₹6L invested → extra ₹1.26 crore! The last decade adds 2.5x more corpus than the first two decades combined.
Worked Example 2 — The Cost of Starting Late
Investor A starts at 25, Investor B starts at 35 — both target retirement at 60
Investor A (invests for 35 years at ₹5,000/month, 12%): Corpus ≈ ₹3.24 crore
Investor B (invests for 25 years at ₹5,000/month, 12%): Corpus ≈ ₹94.9 lakh
Investor A invests only ₹6L more (10 years × ₹72K) but ends up with ₹2.29 crore more
The extra decade of compounding creates 3.4× more wealth — far beyond the extra investment amount
Worked Example 3 — The Early Starter Paradox
Priya invests ₹5,000/month from age 25 to 35 (10 years) then stops. Raj invests from 35 to 60 (25 years). Both at 12%.
Priya: Invests ₹6L total (10 years). Stops at 35. Corpus at 35: ₹11.6L
₹11.6L compounds alone from 35 to 60 (25 years): ₹11.6L × (1.12)^25 = ₹1.97 crore
Raj: Invests ₹15L total (25 years). At 60: corpus ≈ ₹94.9 lakh
Priya invested ₹9L LESS but has ₹1.02 crore MORE — purely because she started 10 years earlier
This is the single most powerful demonstration of why starting early beats investing more later
Compounding Frequency — How Often Matters
| Compounding Frequency | Effective Annual Rate at 12% Nominal | ₹1L after 20 years |
|---|---|---|
| Annual | 12.00% | ₹9,64,629 |
| Quarterly | 12.55% | ₹10,64,089 |
| Monthly | 12.68% | ₹10,89,255 |
| Daily | 12.75% | ₹11,02,317 |
📌 Most important takeaway: The three levers of compounding are rate of return, time, and consistency. Of these, time is the most powerful and also the only one you cannot buy back. Start with whatever amount you can afford, even ₹500/month — the clock of compounding begins the moment you invest the first rupee.
💡 The ₹1 crore milestone: To reach ₹1 crore at 12% CAGR, invest ₹2,861/month starting at 25 (40-year horizon). Starting at 35: ₹10,011/month. Starting at 45: ₹43,471/month. Every 10-year delay forces roughly 4× more monthly investment to reach the same goal. Time is your most valuable financial asset.
📈 Calculate Your Compounding Growth — Free
Enter monthly SIP, rate, and years. See the power of compounding in action.
→ Open SIP CalculatorRelated Calculators & Articles
Real Indian Wealth Creation — Mutual Fund Category Data
Abstract compounding formulas become concrete when applied to actual Indian mutual fund history. Here are realistic scenarios using historical Nifty 50 and large-cap category data.
Scenario 1 — ₹5,000/Month SIP in Nifty 50 Index Fund (2004–2024)
Using historical Nifty 50 CAGR of approximately 13% for the 2004–2024 period (20 years):
FV = ₹5,000 × [((1 + 0.13/12)^240 − 1) / (0.13/12)] ≈ ₹70.3 lakh
Total amount invested: ₹5,000 × 240 months = ₹12 lakh
Returns generated purely by compounding: ₹58.3 lakh — nearly 5× the invested amount
Scenario 2 — ₹1,000/Month in Large-Cap MF Category (2004–2024)
SEBI large-cap category average CAGR approximately 12% for 2004–2024:
FV = ₹1,000 × [((1.01)^240 − 1) / 0.01] ≈ ₹9.89 lakh
Total invested: ₹1,000 × 240 = ₹2.4 lakh | Final corpus: ₹9.89 lakh
Even ₹1,000/month — the price of one restaurant meal per day — becomes nearly ₹10 lakh over 20 years through compounding.
The back-loaded nature of compounding: In both scenarios above, approximately 75–80% of the final wealth was created in the last 5–7 years of the 20-year journey. This is compounding’s signature back-loading — slow and unimpressive in the early years, explosive in the final years. It is also why investors who exit early (at 10–15 years instead of 20) leave the vast majority of their wealth unclaimed. Important caveat: These scenarios use historical data to illustrate compounding mechanics. Past returns do not guarantee future performance. Actual returns will differ based on fund selection, market conditions, and investment timing.
The 3 Enemies of Compounding
Compounding builds wealth exponentially — but three powerful enemies silently erode that growth. Understanding and minimising them is as important as choosing the right investment.
Enemy 1 — Inflation
Inflation reduces your real (purchasing power-adjusted) return. At 6% inflation (India’s approximate long-run CPI average), ₹10,000 today has purchasing power of only ₹7,473 in 5 years. If your investment grows at 7% but inflation runs at 6%, your real return is only 0.94% — barely above zero after all that effort.
The implication: any investment growing below the inflation rate is destroying real wealth, even if the nominal balance is rising. Savings accounts (3–4%) and many traditional insurance products (endowment plans at 4.5–5% XIRR) fall into this trap.
Enemy 2 — Taxes
LTCG on equity at 12.5% (on gains above ₹1.25 lakh per year, effective FY 2026-27) takes a meaningful bite from compounding at the redemption stage. Dividends are taxed at your income slab rate (used to be DDT at fund level; now passed to investor).
LTCG Tax Impact on a 20-Year Corpus
₹1 lakh invested → grows to ₹9.65 lakh at 12% CAGR over 20 years
Total gain: ₹8.65 lakh | Less ₹1.25 lakh LTCG exemption (1 year’s worth) = taxable gain ₹7.4 lakh
LTCG tax at 12.5%: ₹92,500 | After-tax corpus: ₹8.73 lakh
Tax impact: ₹92,500 on a ₹9.65 lakh corpus — roughly 9.6% of the final value. Manageable, but real. Staggered withdrawals over multiple years can maximise the annual ₹1.25 lakh exemption.
Enemy 3 — Fees and Expense Ratios
This is the most insidious enemy because it operates silently, every single day, on your entire corpus — not just on gains. The expense ratio is the annual fee charged by the fund, deducted from NAV daily.
| Expense Ratio | Fund Type | ₹1 lakh after 20 years (12% gross return) | Difference vs Index Fund |
|---|---|---|---|
| 0.10% | Index fund (direct) | ₹8.97 lakh | Baseline |
| 0.50% | Large-cap direct plan | ₹8.23 lakh | −₹74,000 |
| 1.00% | Active fund direct plan | ₹7.40 lakh | −₹1.57 lakh |
| 2.00% | Regular plan (via distributor) | ₹5.84 lakh | −₹3.13 lakh |
The 2% regular plan trap: At a 2% expense ratio vs 0.10% (index fund), you lose ₹3.13 lakh on a ₹1 lakh investment over 20 years — more than 3× your original investment gone to fees. This is not a small rounding error; it is the difference between ₹8.97 lakh and ₹5.84 lakh final corpus from the same underlying investments. Solution: Always invest in Direct plans (0.1–0.5% for equity, 0.1–0.2% for index funds). Platforms like Groww, Zerodha Coin, and Kuvera offer direct plans. Avoid regular plans for any long-term investment goal above 5 years.
Frequently Asked Questions
Compounding Applied to Debt — The Dark Side
Compounding works just as powerfully against you when you’re in debt. The same exponential mathematics that builds wealth in investments destroys it in high-interest debt:
| Debt Type | Interest Rate | ₹1L grows to in 5 years | In 10 years |
|---|---|---|---|
| Home Loan | 9% | ₹1.54L | ₹2.37L |
| Car Loan | 10% | ₹1.61L | ₹2.59L |
| Personal Loan | 16% | ₹2.10L | ₹4.41L |
| Credit Card | 36% | ₹4.65L | ₹21.6L |
₹1 lakh in unpaid credit card debt at 36% becomes ₹21.6 lakh in 10 years — without making a single additional charge. This is compound interest working at its most destructive. The mathematical urgency of clearing high-interest debt before investing cannot be overstated.
Teaching Compounding to Children — The Best Financial Gift
Warren Buffett often credits his wealth to starting investing at age 11. The single most powerful financial education you can give a child is teaching them compounding through experience:
- Open a Sukanya Samriddhi account for daughters: ₹1,000/month from birth to 15 at 8.2% creates ₹54+ lakh at age 21 — a tangible demonstration of 21 years of compounding
- Start a minor’s mutual fund SIP: Even ₹500/month in a large-cap index fund from age 10 to 18 (8 years), then left to compound to age 30 (12 more years), creates approximately ₹2.5-3 lakh — from just ₹48,000 invested
- Show the compounding table: Have children calculate how ₹10,000 grows at 10% over 10, 20, 30 years. The visual jump from ₹25,937 (10yr) to ₹67,275 (20yr) to ₹1,74,494 (30yr) makes compounding viscerally real
The Latte Factor — Small Daily Habits Compounded
Author David Bach’s “Latte Factor” concept applies compounding to small daily expenditures. The same principle works in reverse — small daily savings compounded create significant wealth:
₹200/day saved and invested — 25 years at 12%
₹200/day = ₹6,000/month = ₹72,000/year
25-year SIP at 12% CAGR: approximately ₹1.06 crore
Total invested: ₹18 lakh | Compounding contribution: ₹88 lakh
This ₹200/day is one restaurant meal skipped, or one subscription cancelled, or one impulsive online purchase avoided — per day. The compounding makes small discipline decisions extraordinarily impactful over decades.
Compounding and Inflation — The Race That Matters
Compounding at nominally impressive rates can still mean losing the race against inflation:
| Investment | Nominal CAGR | Inflation (5%) | Real Return | ₹1L after 20 years (real) |
|---|---|---|---|---|
| Savings Account | 3.5% | 5% | -1.5% | ₹74,000 (losing value!) |
| FD (30% bracket, taxable) | 7% × 0.7 = 4.9% | 5% | -0.1% | ₹98,000 (barely flat) |
| PPF (tax-free) | 7.1% | 5% | 2.1% | ₹1.52L (modest real growth) |
| Equity SIP | 12% | 5% | 6.7% | ₹3.63L (strong real growth) |
The compounding race is not just about growing money — it’s about growing faster than inflation. Only equity SIPs among common investment options deliver meaningful positive real returns over 20+ year horizons for most Indian investors in higher tax brackets.
1 thought on “Power of Compounding 2026 — How ₹5,000/Month Becomes ₹1 Crore | CalcDesk.in”