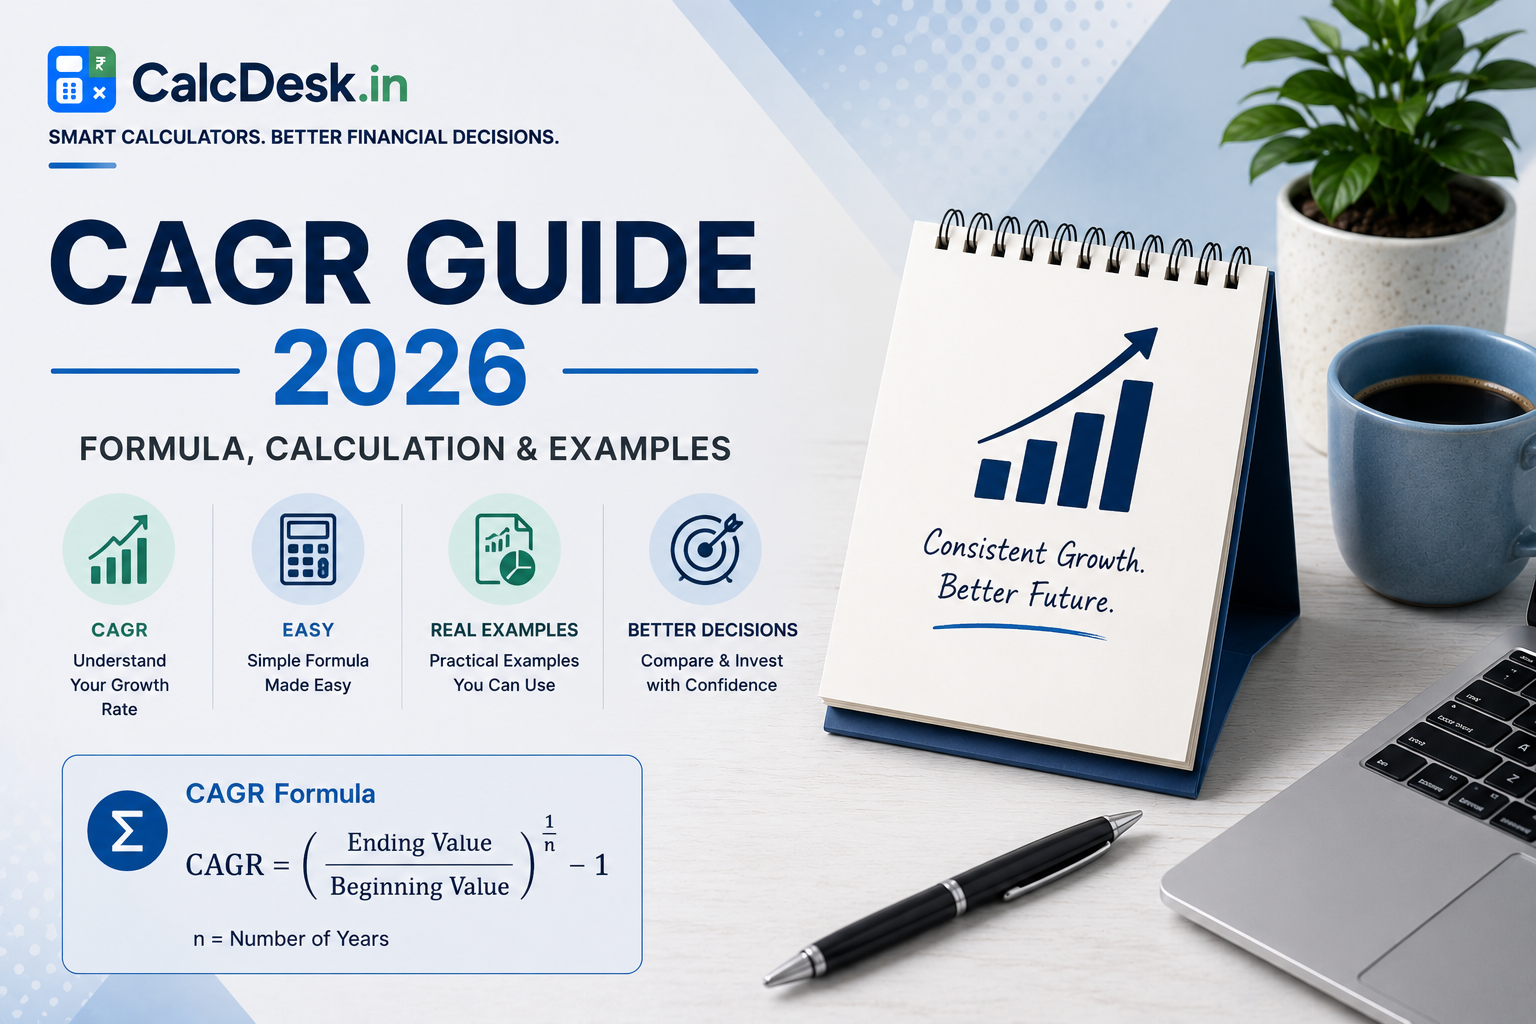
CAGR Guide 2026 — Formula, Calculation & Worked Examples
CAGR — Compound Annual Growth Rate — is the most universally used metric to measure and compare investment performance in India. When a mutual fund advertises “15% CAGR returns over 10 years,” or when you see a stock’s 5-year performance expressed as 22% CAGR, this single number tells you the smoothed annualised growth rate that would convert the initial investment to the final value assuming annual compounding. Without CAGR, comparing a 200% return over 3 years versus a 400% return over 10 years is practically impossible — CAGR converts both to a per-year rate you can compare directly.
This guide explains the CAGR formula, step-by-step calculation, worked examples for mutual funds, stocks, and real estate, and how CAGR differs from absolute returns and XIRR. Use CalcDesk’s free CAGR Calculator to compute any investment’s CAGR instantly.
What is CAGR — The Core Concept
CAGR is not the actual year-by-year return. It’s the hypothetical constant rate at which an investment would have grown from its initial value to its final value, assuming returns were compounded annually. Think of it as the “smoothed” growth rate that strips out year-to-year volatility.
An investment can fall 30% one year and rise 50% the next. CAGR doesn’t care about this journey — it only looks at where you started and where you ended, and calculates the single annual rate that explains the net result.
CAGR Formula
CAGR Formula
Where:
Ending Value = Final value of investment
Beginning Value = Initial amount invested
n = Number of years held
Multiply result by 100 to express as percentage
Worked Example 1 — Mutual Fund Lump Sum
₹1,00,000 invested in a flexi-cap fund, grew to ₹3,10,585 in 12 years
CAGR = (3,10,585 / 1,00,000)^(1/12) − 1
= (3.10585)^(0.0833) − 1
= 1.098 − 1
CAGR = 9.8% per annum
Individual years ranged from −32% (2008 crash) to +78% (2009 recovery), but the net annualised rate smooths out to 9.8%
Worked Example 2 — Stock Investment
Stock bought at ₹120, now at ₹850 after 7 years
CAGR = (850 / 120)^(1/7) − 1 = (7.083)^(0.143) − 1 = 1.324 − 1
CAGR = 32.4% per annum
Absolute return = (850−120)/120 × 100 = 608% (sounds impressive but hides the time dimension)
32.4% CAGR is extraordinary — compare Nifty 50 CAGR of ~12-14% over the same period to benchmark the outperformance
Worked Example 3 — Two Funds, Different Periods
Comparing Fund A and Fund B on CAGR basis
Fund A: ₹2,00,000 → ₹6,50,000 in 10 years
Absolute return: 225% | CAGR = (6.5/2)^(0.1) − 1 = (3.25)^(0.1) − 1 = 12.5%
Fund B: ₹2,00,000 → ₹5,40,000 in 8 years
Absolute return: 170% | CAGR = (5.4/2)^(0.125) − 1 = (2.7)^(0.125) − 1 = 13.2%
Fund B has a higher CAGR despite lower absolute return — it generated better growth per year, just in fewer years
CAGR vs Absolute Return — The Key Difference
| Metric | What It Shows | Best Used For | Limitation |
|---|---|---|---|
| Absolute Return | Total % gain, ignores time | Comparing same holding period | Misleading across different periods |
| CAGR | Annualised compounded rate | Comparing across any time periods | Hides year-to-year volatility |
| XIRR | Annualised return for irregular cash flows | SIP portfolios, multiple investments | More complex to calculate manually |
CAGR of Major Indian Benchmarks
| Benchmark / Asset | 10-Year CAGR (Approx) | 20-Year CAGR (Approx) |
|---|---|---|
| Nifty 50 | 12-14% | 14-16% |
| Nifty Midcap 100 | 14-16% | 16-18% |
| Sensex | 12-14% | 15-17% |
| Bank FD | 6.5-7.5% | 7-8% (historical) |
| Gold | 10-12% | 11-13% |
| Inflation (CPI) | 5-6% | 6-7% (historical) |
📌 CAGR limitation: CAGR tells you the start and end but nothing about the journey. An investment that fell 60% in year 1 then tripled in year 2 shows a good CAGR but is extremely volatile. Always look at year-by-year or rolling returns alongside CAGR to understand risk, not just returns.
How to Use CAGR in Everyday Investing
- Comparing mutual funds: Always compare 5-year or 10-year CAGR against the category average and the benchmark index to assess fund quality
- Evaluating stocks: Check revenue CAGR, profit CAGR, and EPS CAGR alongside price CAGR to understand if stock appreciation is backed by business fundamentals
- Goal planning: If you need ₹50L in 10 years and start with ₹10L, required CAGR = (50/10)^(0.1) − 1 = 17.5%. This tells you whether a conservative or aggressive fund is needed
- Portfolio benchmarking: Calculate your portfolio’s CAGR and compare it to Nifty 50 CAGR over the same exact period — this is the true test of active investing vs passive indexing
💡 Quick mental trick: Use the Rule of 72 alongside CAGR for instant doubling-time estimation — divide 72 by the CAGR. At 12% CAGR, money doubles in 6 years. At 8% CAGR, it takes 9 years. This makes CAGR numbers instantly intuitive without a calculator.
📊 Calculate CAGR Instantly — Free
Enter beginning value, ending value, and years. Get exact CAGR in one click.
→ Open CAGR CalculatorFrequently Asked Questions
CAGR for Real Estate — Why Property Underperforms in CAGR Terms
Real estate investors often cite “my property doubled in 10 years” as proof of good investment returns. But when expressed as CAGR, doubling in 10 years equals only 7.2% CAGR — roughly matching an FD and below equity SIP returns. The CAGR framework exposes real estate’s actual performance:
Property vs Equity — Same 10-Year Period, CAGR Comparison
Flat purchased in 2015 for ₹80L, sold in 2026 for ₹1.5 crore
CAGR = (1,50,00,000 / 80,00,000)^(1/10) − 1 = (1.875)^(0.1) − 1 = 6.5% CAGR
But this ignores: registration and stamp duty (₹5-6L at purchase), maintenance charges (₹12,000-24,000/year), property tax, brokerage at sale (1-2%), and capital gains tax
True net CAGR after all costs: approximately 4.5-5% per annum
Same ₹80L in Nifty 50 SIP (12% CAGR assumption) would have grown to approximately ₹2.48 crore — 65% more than the property
This is why CAGR is such a powerful tool for investment comparison — it strips away the narrative and forces honest arithmetic. Rental income improves real estate CAGR meaningfully (adding 2-3% net rental yield), which is why yield-generating commercial properties are more competitive vs equity on a CAGR basis than residential properties.
CAGR in Business Analysis — Revenue and Profit Growth
Beyond personal investing, CAGR is the standard metric used by analysts to evaluate company growth:
| Metric | FY2020 | FY2026 | 5-Year CAGR | Interpretation |
|---|---|---|---|---|
| Company Revenue | ₹500 Cr | ₹950 Cr | 13.7% | Healthy above-inflation growth |
| Net Profit | ₹50 Cr | <₹40 Cr | Negative | Revenue grew but profitability eroded — investigate |
| EPS | ₹20 | ₹38 | 13.7% | Earnings per share growing — good for investors |
| Stock Price | ₹200 | ₹600 | 24.6% | Market re-rated the company (P/E expansion) |
When stock price CAGR (24.6%) far exceeds EPS CAGR (13.7%), it means the market awarded a higher P/E multiple — this valuation expansion cannot continue indefinitely. Conversely, when EPS CAGR exceeds stock price CAGR, the stock is becoming cheaper over time (P/E compression) — often a value opportunity.