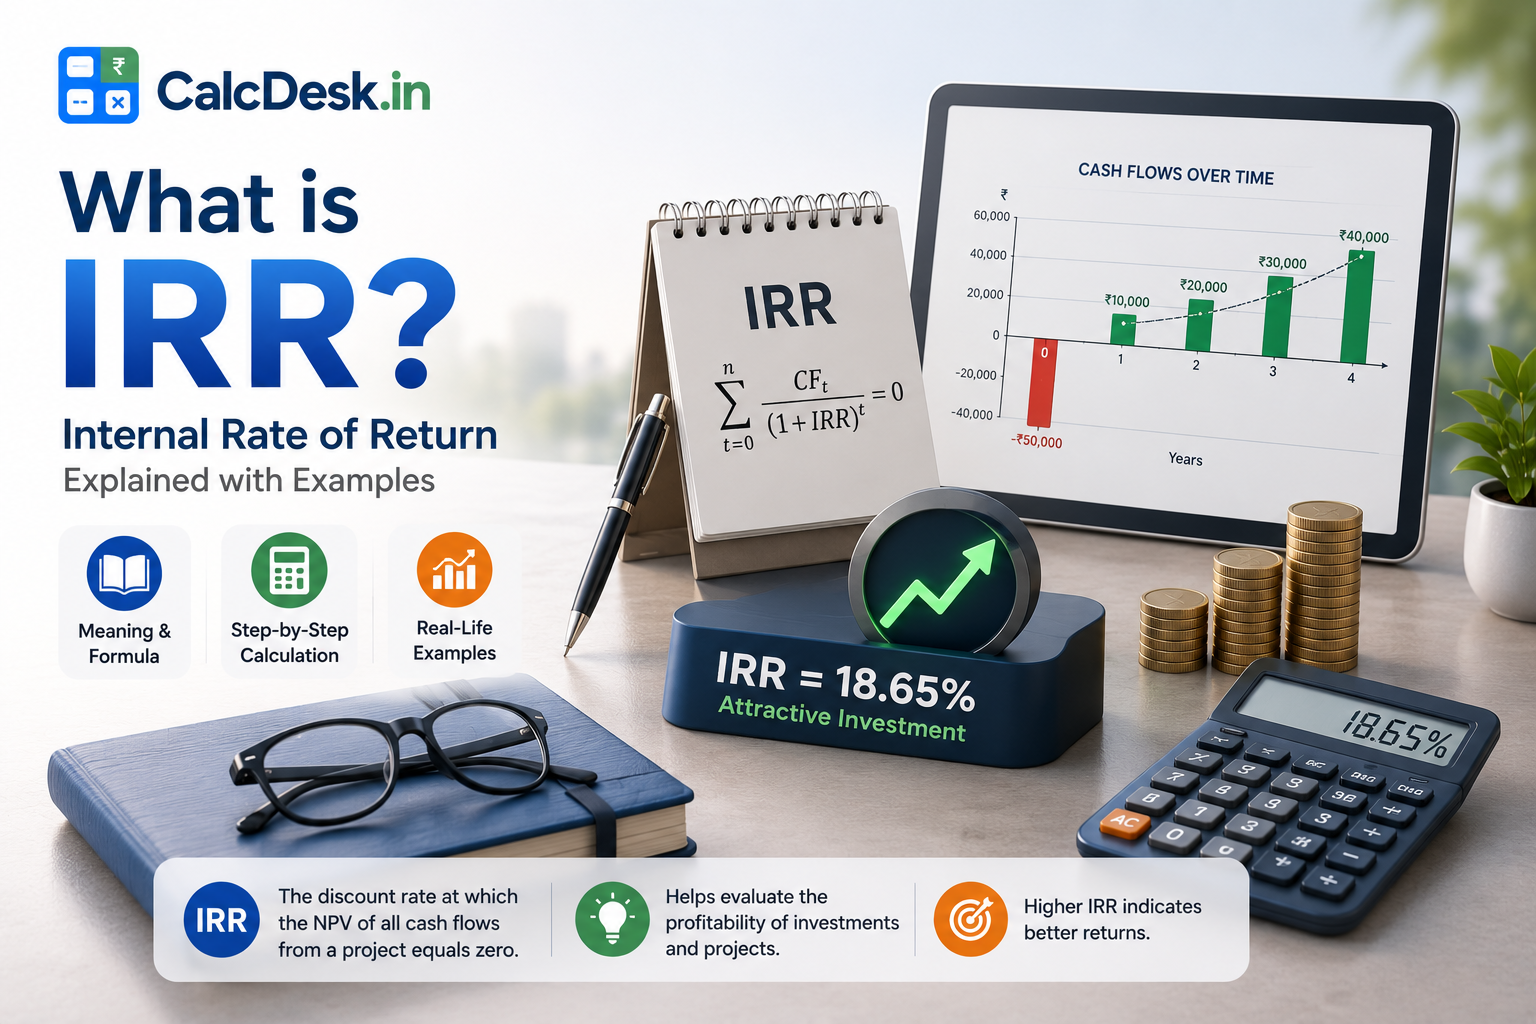
What is IRR? Internal Rate of Return Explained with Examples
IRR (Internal Rate of Return) is a fundamental metric in financial analysis used to evaluate the profitability of investments, business projects, and real estate. It answers the question: “What annual growth rate does this investment effectively deliver?” When you compare a property investment’s IRR of 18% against your bank loan cost of 9%, the difference — called the spread — represents value creation. This guide explains IRR in plain language with worked examples from real estate and business.
IRR — The Core Concept
IRR is the discount rate that makes the Net Present Value (NPV) of all cash flows equal to zero. In practical terms, IRR is the annualised return rate that an investment effectively delivers considering the timing and size of all cash flows — both investments and returns.
IRR Definition
0 = CF₀ + CF₁/(1+r) + CF₂/(1+r)² + … + CFₙ/(1+r)ⁿ
Where:
CF₀ = Initial investment (negative — cash outflow)
CF₁ to CFₙ = Annual cash flows (positive = inflows)
r = IRR (the rate that makes NPV = 0)
In Excel: =IRR(values_range)
For irregular dates: =XIRR(values, dates)
Worked Example 1 — Residential Property Investment
Buy flat for ₹60L, rent it for 5 years, sell for ₹1.05 crore
Year 0: −₹60,00,000 (purchase + registration + stamp duty)
Year 1-5: +₹2,40,000/year (net rental income after maintenance, taxes)
Year 5: +₹1,05,00,000 (sale proceeds net of brokerage)
IRR = =IRR([-6000000, 240000, 240000, 240000, 240000, 10740000])
IRR ≈ 12.4% per annum
If this investor could earn 14%+ in equity SIP with less hassle, real estate underperforms risk-adjusted
Worked Example 2 — Business Project Evaluation
Factory expansion: ₹50L investment, annual profits over 5 years
Year 0: −₹50,00,000 | Year 1: ₹8L | Year 2: ₹12L | Year 3: ₹15L | Year 4: ₹18L | Year 5: ₹20L + ₹5L salvage
IRR = =IRR([-5000000, 800000, 1200000, 1500000, 1800000, 2500000])
IRR ≈ 14.2% per annum
If the company’s cost of capital is 12%, this project creates value (14.2% > 12%). If cost of capital is 15%, reject the project.
Worked Example 3 — Comparing Two Projects
Project A vs Project B — which to choose?
Project A: ₹20L investment, ₹6L/year for 5 years | IRR = 15.2%
Project B: ₹20L investment, ₹3L for 3 years then ₹20L in year 4 | IRR = 16.1%
Project B has higher IRR — but Project A gives steadier cash flows with lower risk
IRR alone can mislead when project sizes, durations, or cash flow patterns differ — always combine with NPV analysis
IRR Decision Rule
| IRR vs Required Return | Decision | Meaning |
|---|---|---|
| IRR > Required Return (Hurdle Rate) | Accept / Invest | Investment creates value above cost of capital |
| IRR = Required Return | Break-even | Investment barely covers cost of capital |
| IRR < Required Return | Reject | Better returns available elsewhere at same or lower risk |
Limitations of IRR
- Reinvestment assumption: IRR assumes all interim cash flows are reinvested at the IRR itself — often unrealistic at very high IRRs
- Multiple IRRs: Projects with alternating positive/negative cash flows can have multiple valid IRR solutions
- Ignores scale: A small project with 30% IRR may create less value than a large project with 15% IRR — always use NPV alongside IRR
- Timing sensitivity: IRR is highly sensitive to early vs late cash flows — front-loaded projects appear better even if total return is similar
📌 Practical use: IRR is best used as a screening tool — quickly compare multiple investment options. Projects passing the IRR hurdle rate are then evaluated more deeply using NPV, payback period, and sensitivity analysis before final decision.
🏢 Explore Financial Calculators — Free
Calculate CAGR, SIP, compound interest, home loan EMI — all free on CalcDesk.
→ Explore All CalculatorsRelated Calculators & Articles
How to Calculate IRR in Excel — Step by Step
The Excel IRR function is straightforward once you understand the cash flow sign convention. Here is a complete walkthrough with a real example.
IRR in Excel — Step-by-Step Setup
Year 0 (initial investment): NEGATIVE number
Years 1 to N (returns received): POSITIVE numbers
Example project:
Year 0: -₹5,00,000 (investment)
Year 1: +₹1,50,000
Year 2: +₹2,00,000
Year 3: +₹2,00,000
Year 4: +₹1,50,000
Year 5: +₹1,00,000
Step 2: Enter in Excel
A1: -500000 | A2: 150000 | A3: 200000
A4: 200000 | A5: 150000 | A6: 100000
Step 3: IRR formula
=IRR(A1:A6) → Result: 22.8%
Step 4: For irregular dates, use XIRR
Add dates in Column B
=XIRR(A1:A6, B1:B6) → More precise result
Step 5: If =IRR() returns #NUM! error
Cause: Cash flows never turn positive, or unusual pattern
Fix: Provide a guess → =IRR(A1:A6, 0.1)
Decision Rule Applied to This Example
IRR result: 22.8% | Company’s hurdle rate (cost of capital): 15%
22.8% > 15% → Accept the project — it creates value above the cost of capital
If hurdle rate were 25%: 22.8% < 25% → Reject — better returns required to justify the risk
Hurdle rate is typically your WACC (Weighted Average Cost of Capital) for business projects, or your required rate of return for investment decisions.
Quick reference — IRR formula variants: =IRR(values) for annual regular cash flows. =XIRR(values, dates) for irregular cash flow dates (recommended for real investments). =MIRR(values, finance_rate, reinvest_rate) for Modified IRR when reinvestment assumption matters. Always prefer XIRR over IRR for actual investment analysis — it handles real-world date irregularities accurately.
IRR for Insurance Products — ULIP and Endowment Plans
One of the most practically important uses of IRR for Indian investors is evaluating insurance-linked investment products like endowment plans and ULIPs. Agents rarely show this number — because it is typically very low.
Traditional Endowment Plan IRR Calculation — LIC Jeevan Anand Example
Policy parameters: Annual premium ₹1,00,000 | Policy term: 20 years | Sum Assured: ₹12,50,000
Cash flows for XIRR:
Years 0–19: −₹1,00,000 each year (20 premium payments)
Year 20: Maturity value = Sum Assured ₹12,50,000 + Accumulated Bonus (approx ₹18,000/year × 20 = ₹3,60,000) + Final Addition ≈ ₹2,00,000. Total maturity ≈ ₹18,10,000.
Apply XIRR to these cash flows: XIRR ≈ 4.8–5.2%
Compare: PPF at 7.1% (tax-free), FD at 7% (taxable), equity SIP at 12%+ (historical). The endowment plan delivers below-PPF returns despite locking your money for 20 years.
Why agents don’t show this number: Endowment plans are often presented as “₹34 lakh on ₹20 lakh invested” — absolute return framing that hides the low annualised return. A 5% XIRR sounds unattractive; “₹34 lakh return” sounds appealing. Always calculate XIRR before buying any insurance-linked investment product.
How to get the illustration: Request a “Benefit Illustration” document from the insurer — IRDAI mandates this for all life insurance products. The illustration shows year-by-year cash flows, which you can plug into XIRR directly.
What to do with existing policies: If you have paid premiums for less than 3 years, surrendering returns very little. If 3+ years are paid, consider the paid-up option — stop paying premiums, keep a reduced sum assured, and collect a smaller maturity value. Only surrender if the ongoing premium burden is very high relative to your cash flow. Never buy a new endowment plan — term insurance + mutual fund is always superior.
Frequently Asked Questions
Modified IRR (MIRR) — Fixing IRR’s Reinvestment Assumption
IRR’s biggest limitation — the reinvestment assumption — is addressed by MIRR (Modified Internal Rate of Return). IRR assumes all interim cash flows are reinvested at the IRR rate itself, which is often unrealistic at high IRRs (e.g., a project with 25% IRR assumes you can reinvest all profits at 25% — rarely true). MIRR uses a more realistic reinvestment rate:
MIRR vs IRR
MIRR: Specifies separate finance rate and reinvestment rate
In Excel: =MIRR(values, finance_rate, reinvest_rate)
Example: finance_rate = 10% (cost of capital)
reinvest_rate = 8% (expected reinvestment return)
A project with 22% IRR might show 16% MIRR
— more realistic and comparable across projects
MIRR is particularly useful when comparing projects with very different IRRs or cash flow timings — it removes the distortion caused by the unrealistic reinvestment assumption embedded in traditional IRR.
IRR in Equity Mutual Fund Evaluation
Fund managers use IRR when evaluating private equity or pre-IPO investments within their portfolios. For retail investors, XIRR (IRR with dates) is the practical equivalent:
- A PE fund that invested ₹100 crore in 2018 and exited at ₹350 crore in 2026 (7 years) delivered IRR = (350/100)^(1/7) − 1 = 19.5% — this is the metric PE funds advertise as their “fund IRR”
- Venture capital funds track IRR for each portfolio company and the blended fund-level IRR
- For real estate developers, project IRR (including construction period cash flows) determines whether a project is viable given their cost of land acquisition, construction, and cost of capital
IRR for Startup Investing and Angel Investments
Angel investors and venture capitalists think primarily in IRR terms when evaluating startup investments:
Typical Angel Investment IRR Calculation
Angel invested ₹25L in a startup at ₹1 crore valuation (25% stake)
Startup acquired 5 years later at ₹8 crore valuation
Angel’s exit value: 25% × ₹8 crore = ₹2 crore
IRR = (2,00,00,000 / 25,00,000)^(1/5) − 1 = (8)^(0.2) − 1 = 51.6% IRR
This sounds extraordinary — but angel investing has high failure rates. Most angels invest in 10-20 startups expecting 70% to fail, 20% to return capital, and 10% to deliver the IRR. The blended portfolio IRR across all investments is typically 15-25% for successful angel investors.
IRR Trap — Why High IRR Projects Can Still Be Bad Decisions
A project with 40% IRR sounds exceptional. But consider:
- Scale problem: A ₹1L investment at 40% IRR generates ₹1.4L after year 1 — a gain of ₹40,000. A ₹10 crore investment at 20% IRR generates ₹2 crore in the same year. Which creates more wealth? The large project at lower IRR.
- Duration problem: A 1-year project with 40% IRR gives you back money in 12 months — you then need to find another 40% IRR project (difficult). A 10-year project at 20% IRR compounds consistently without the reinvestment challenge.
- Always combine IRR with NPV and scale: IRR tells you efficiency; NPV tells you total value; scale tells you whether the opportunity is worth the management effort. All three together form the complete picture.