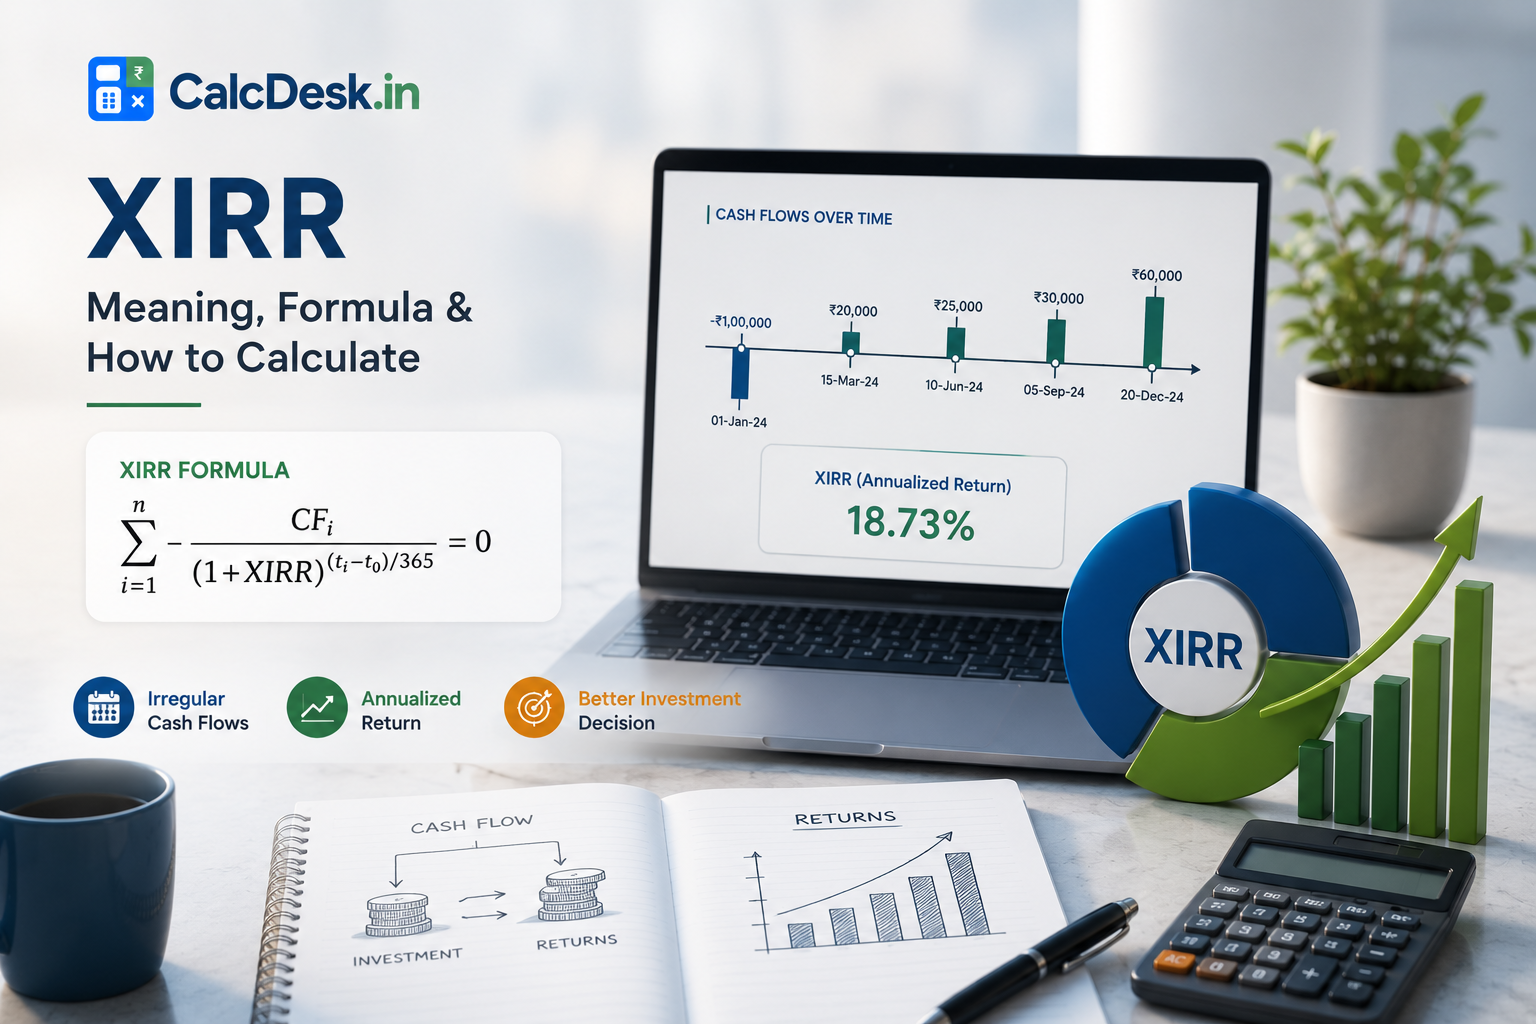
What is XIRR? Meaning, Formula & Calculation Explained
XIRR — Extended Internal Rate of Return — is the standard metric for measuring the annualised return on any investment with multiple cash flows at different dates. When you make 60 monthly SIP payments of ₹10,000 and then redeem ₹8,50,000, XIRR tells you the true annualised return accounting for when each rupee was invested. It’s more accurate than CAGR for SIPs and is shown automatically on most Indian mutual fund platforms (Groww, Zerodha Coin, Kuvera, etc.).
What XIRR Measures
XIRR finds the single annualised interest rate that, when applied to each cash flow adjusted for its exact timing, makes the net present value of all cash flows equal to zero. In practical terms:
- Each SIP instalment is treated as a separate investment with its own time horizon
- The ₹10,000 invested in month 1 had 5 years to grow; the ₹10,000 in month 60 had only 1 month
- XIRR finds the single rate that explains all this growth across all timing-weighted investments
XIRR Formula
XIRR Mathematical Definition
0 = Sum of [ Cash_Flow_i / (1 + r)^(d_i / 365) ]
Where:
Cash_Flow_i = each SIP payment (negative) and redemption (positive)
d_i = days from the first cash flow date to this cash flow
r = XIRR (solved iteratively)
In Excel/Sheets: =XIRR(values_range, dates_range)
Worked Example 1 — Simple 3-Year SIP
₹10,000/month SIP for 36 months, current value ₹4,60,000
Total invested: ₹3,60,000 | Gain: ₹1,00,000 | Absolute return: 27.8%
Wrong approach (CAGR): (4,60,000/3,60,000)^(1/3) − 1 = 8.5% — treats all money as 3-year-old
Correct (XIRR): ≈ 14-16% — accounts for first instalment earning 3 years, last instalment earning 1 month
XIRR is higher because it correctly values the early instalments’ longer compounding period
Worked Example 2 — XIRR in Excel Step by Step
₹5,000/month SIP, April 2022 to March 2025, current value ₹2,20,000
Column A: −5000 (36 rows, one per month) then +220000 on row 37
Column B: 01-04-2022 through 01-03-2025 (36 dates) then 01-04-2025 on row 37
Formula in any empty cell: =XIRR(A1:A37, B1:B37)
Result: approximately 13.8% XIRR
This means your ₹5,000/month SIP effectively earned 13.8% per annum annualised
Worked Example 3 — XIRR with Irregular Investments
Lump sum + SIP combination over 2 years
Jan 2023: ₹50,000 lump sum invested | Then ₹5,000/month for 24 months
Total invested: ₹1,70,000 | Current value (Jan 2025): ₹2,15,000
XIRR calculation treats each cash flow date differently — lump sum earns 2 full years while last SIP earns 1 month
XIRR result: ≈ 17.5% — significantly different from CAGR calculation on total invested
What is a Good XIRR?
| Fund Category | Good XIRR (10-yr SIP) | Context |
|---|---|---|
| Large Cap Equity Fund | 11-14% | Broadly matches Nifty 50 historical CAGR |
| Mid Cap / Small Cap Fund | 14-18%+ | Higher risk, higher return potential |
| ELSS (Tax Saving) | 12-15% | Equity returns with 80C benefit |
| Balanced / Hybrid Fund | 9-12% | Lower equity allocation, more stable |
| Debt / Liquid Fund | 6-8% | Fixed income equivalent |
📌 XIRR changes daily: Since XIRR is calculated using the current portfolio value (NAV), it changes every market day. A 20% XIRR during a bull run can drop to 5% after a sharp correction — without any change in investment strategy. Always evaluate XIRR over rolling periods (5-year, 10-year rolling XIRR) rather than a single point-in-time reading for meaningful performance comparison.
💡 Tip: Compare your SIP XIRR against the fund’s benchmark CAGR over the same period. If your XIRR is below the benchmark CAGR, the fund has underperformed even accounting for SIP averaging effects. If above benchmark, the fund has added alpha.
📊 Calculate SIP Returns — Free
Enter monthly amount, return rate, and years. Project your SIP corpus.
→ Open SIP CalculatorRelated Calculators & Articles
XIRR Benchmarks for Indian Investors — What’s Good?
XIRR numbers mean nothing in isolation — they need a benchmark. Here is a reference table for evaluating your portfolio XIRR based on the instrument and investment horizon.
| Instrument / Category | Typical XIRR Range | Appropriate Horizon | Verdict |
|---|---|---|---|
| Savings account | 3–4% | Emergency fund only | Below inflation — acceptable only as emergency buffer |
| Liquid fund | 6–7% | 1–3 months | Good for short-term parking, better than savings account |
| Ultra short / low duration debt fund | 7–8.5% | 3–12 months | Target for short-term goals; marginally beats inflation |
| Arbitrage fund | 6.5–7.5% (equity-taxed) | 3–12 months | Better post-tax option for 30%+ tax bracket investors |
| Balanced advantage / hybrid fund | 9–11% | 3–5 years | Good risk-adjusted return for medium-term goals |
| Large-cap equity / Nifty 50 index | 11–14% | 10+ years | Long-term wealth creation benchmark — minimum acceptable |
| Mid/small cap equity | 13–18% | 7+ years minimum | High potential but high volatility; not for short horizon |
| Below 6% (any category) | <6% | Any | Below CPI inflation — real loss of purchasing power |
How to benchmark your XIRR: Calculate your fund’s XIRR for your specific investment period. Then find the benchmark index XIRR for the same period — NSE India’s website (nseindia.com) publishes total return index (TRI) data for Nifty 50, Nifty Midcap 150, etc. If your fund’s XIRR exceeds the benchmark TRI XIRR for the same period, the fund manager has added value (alpha). If below, consider switching to a low-cost index fund.
XIRR on Mutual Fund Statements — Reading Your CAS
Most Indian investors receive their mutual fund holdings via CAS (Consolidated Account Statement) — a combined statement of all fund holdings issued by CAMS or KFintech. Understanding what the XIRR column actually shows helps you use it correctly.
What is CAS and where to get it: CAS is issued by CAMS (camsonline.com) or KFintech (kfintech.com) based on which RTAs your funds use. You can download it by logging in with your PAN and email/phone. It consolidates all folios across all AMCs into a single statement with current values and XIRR.
What the XIRR column shows: The annualised return from your first purchase in that folio to today’s NAV. This is the XIRR since inception of your investment in that particular fund — not for a specific time window you choose.
Why CAS XIRR may not reflect your experience:
- If you redeemed units mid-way and reinvested, the CAS may not accurately capture the break. Always verify your own XIRR calculation for complex transaction histories.
- If you made a lump sum 8 years ago and started SIPs 3 years ago, the blended XIRR will be skewed toward the lump sum’s long holding period — it may look better or worse than either investment in isolation.
- CAS XIRR is calculated on the statement generation date — it changes every day as NAV changes. A statement from last month may show a very different XIRR than one generated today.
How to recalculate XIRR for a specific period: Download the full transaction statement (not just portfolio) from CAMS or KFintech. Filter transactions by your desired date range. Enter each transaction as a negative cash flow on its actual date. Enter the current portfolio value (or redemption value) as a positive cash flow on the end date. Apply =XIRR(values, dates) in Excel. This gives you the precise XIRR for your chosen window — useful for comparing fund performance across specific market cycles.
CAMS InstaAccess app: Shows portfolio-level XIRR, fund-level XIRR, and allows date range filtering — more user-friendly than extracting transaction statements manually. Available on Android and iOS. Log in with your PAN-linked mobile number.
The XIRR check that matters most: Find the Nifty 50 TRI XIRR for the exact period you have been invested in your fund. If your fund’s XIRR is higher than Nifty 50 TRI XIRR for the same period, active fund management added value — continue. If lower, consider switching to a Nifty 50 index fund (direct plan, 0.1–0.2% expense ratio). This comparison removes luck (market timing) and isolates fund manager skill.
Frequently Asked Questions
XIRR Limitations — When It Can Mislead
XIRR is the most accurate return metric for SIP portfolios, but it has important limitations to understand:
- Recency bias: XIRR is disproportionately affected by recent market performance. If markets rose 40% in the last year, your XIRR looks excellent — but it may not reflect your fund’s long-term quality. Conversely, a market crash in the last month can make a 10-year SIP portfolio show poor XIRR even if the fund performed well historically
- Not comparable across start dates: An investor who started SIP in April 2020 (at COVID market lows) shows extraordinary XIRR; one who started in January 2020 (pre-crash) shows much lower XIRR — same fund, same tenure, very different XIRR purely due to start date luck
- Cannot compare across funds easily: Two XIRR numbers from different investors in the same fund will differ based on when each started. To compare funds fairly, compare their benchmark-relative CAGR (from factsheets), not your personal XIRR
- Partial redemptions complicate calculation: If you’ve redeemed some units (for tax-loss harvesting or liquidity), include those redemptions as positive cash flows in the XIRR calculation — else the result will be inaccurate
XIRR for Goal-Based Investing — Are You on Track?
XIRR is a powerful tool to check whether your investments are on track to meet financial goals:
Goal Tracking with XIRR
Goal: ₹50 lakh for child’s education in 10 years | Required CAGR: 12%
Current SIP portfolio XIRR (after 5 years): 14.5%
Action: Currently ahead of target — can slightly reduce monthly SIP and still meet goal, or keep SIP to exceed goal
If XIRR were 8%: Behind target — increase SIP amount or extend horizon. Use SIP calculator to find new monthly amount needed.
Review XIRR vs required return annually — adjust SIP amount if significantly behind. Don’t panic about short-term XIRR fluctuations; only act if consistently below target over 2-3 year rolling periods.
Step-Up SIP and XIRR — Understanding the Effect
Many investors increase their SIP amount annually (step-up SIP). This affects XIRR calculation because later instalments are larger. Here’s what to expect:
- A step-up SIP (starting at ₹5,000/month, increasing 10% annually) will show a different XIRR than a flat ₹5,000/month SIP even in the same fund — because the larger later instalments have less time to compound, pulling XIRR down slightly
- Despite lower apparent XIRR, the step-up SIP creates significantly more absolute corpus — ₹5,000 growing at 10% annually for 20 years creates 2.3x more corpus than flat ₹5,000/month
- Don’t optimise for XIRR appearance — optimise for total corpus. Step-up SIPs are always superior in corpus terms even if XIRR looks slightly lower
Common XIRR Errors in Excel — And How to Fix Them
- #NUM! error: Occurs when XIRR cannot converge. Common causes: no positive cash flow (forgot to add current portfolio value), dates not in chronological order, or very unusual cash flow patterns. Fix: ensure the last row has a positive number (current value) and dates are sorted ascending
- Result looks wrong (too high or too low): Usually caused by missing cash flows (forgot some SIP months) or using wrong sign convention (all negative, or all positive). Cash outflows must be negative; cash inflow (redemption/current value) must be positive
- Date format issues: Excel’s XIRR requires dates in proper date format — not text strings. Format the date column as “Date” in Excel before entering values to avoid silent errors