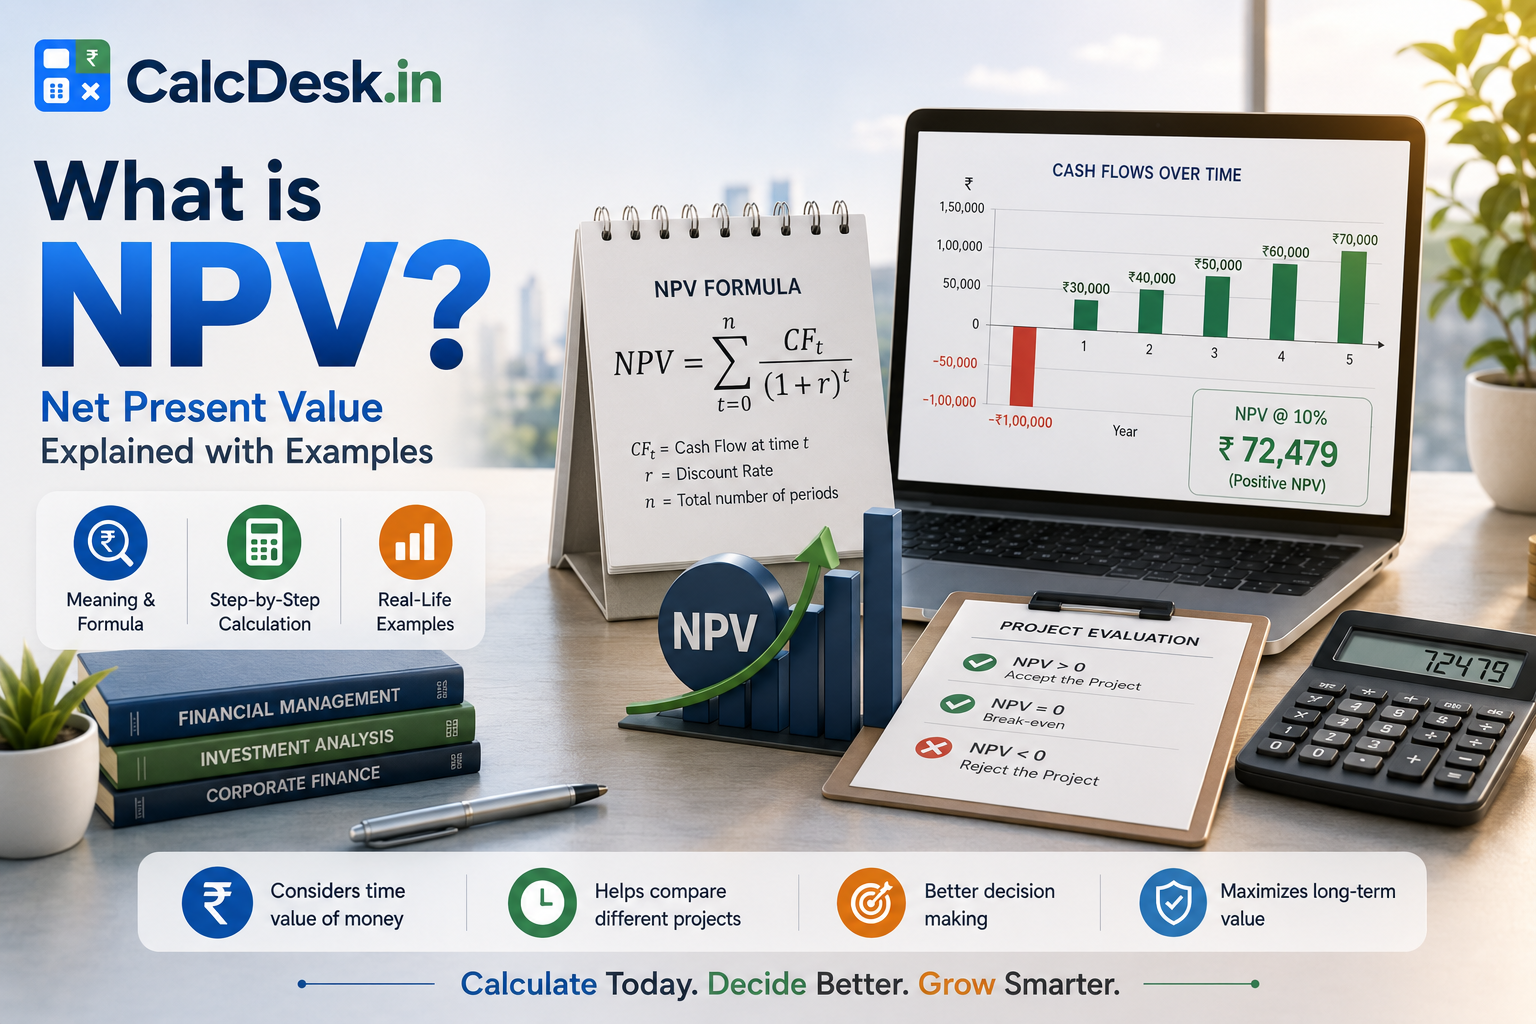
What is NPV? Net Present Value Formula & Examples
Net Present Value (NPV) is the gold standard of investment analysis — it answers one fundamental question: does this investment create or destroy value? By converting all future cash flows into today’s rupees using a discount rate, NPV allows you to directly compare a ₹1 crore investment today against the stream of returns it generates over many years. A positive NPV means the investment is worthwhile; a negative NPV means it isn’t.
The NPV Formula
Net Present Value Formula
Where:
CF_t = Cash Flow in year t
r = Discount rate (required rate of return)
n = Number of years
In Excel: =NPV(r, CF1:CFn) + Initial_Investment
Note: Excel NPV starts from Year 1; add Year 0 (negative investment) separately
Why Discount Future Cash Flows?
Money received in the future is worth less than money today for three reasons: inflation erodes purchasing power, there’s an opportunity cost (money today could be invested and grow), and there’s risk that future payments may not materialise. The discount rate captures all three factors. A 12% discount rate means “I need at least 12% annually to justify not keeping my money in a comparable investment.”
Worked Example 1 — Simple Business Project
Manufacturing machine: ₹10L cost, generates ₹3L/year for 5 years. Discount rate: 12%
NPV = −10,00,000 + 3,00,000/(1.12)¹ + 3,00,000/(1.12)² + 3,00,000/(1.12)³ + 3,00,000/(1.12)⁴ + 3,00,000/(1.12)⁵
= −10,00,000 + 2,67,857 + 2,39,158 + 2,13,534 + 1,90,655 + 1,70,228
= −10,00,000 + 10,81,432 = NPV = +₹81,432
Positive NPV → accept the project. The machine creates ₹81,432 of value above the 12% hurdle.
Worked Example 2 — Real Estate Investment
Apartment: buy ₹80L, rent ₹2.4L/year for 7 years, sell ₹1.25 crore. Discount rate: 12%
Year 0: −₹80,00,000
Years 1-7: ₹2,40,000/year (net rent) | Year 7 additional: ₹1,25,00,000 (sale)
PV of rent (7 years, 12%): ₹2,40,000 × 4.5638 = ₹10,95,312
PV of sale (year 7, 12%): ₹1,25,00,000 / (1.12)^7 = ₹56,51,236
NPV = −80,00,000 + 10,95,312 + 56,51,236 = NPV = −₹12,53,452
Negative NPV → at 12% discount rate, this property investment destroys value vs alternative investment
At 8% discount rate, NPV becomes positive — real estate makes sense only if you’re okay with <12% returns
Worked Example 3 — Choosing Between Two Projects
Project A (₹10L investment, IRR 18%) vs Project B (₹50L investment, IRR 15%)
Project A NPV at 12%: ₹82,000 (positive but small in absolute terms)
Project B NPV at 12%: ₹4,20,000 (lower IRR but creates far more rupee value)
IRR says: choose A (18% > 15%). NPV says: choose B (₹4.2L > ₹82K)
If these are mutually exclusive and you have ₹50L to invest, choose Project B — it creates more absolute wealth
This is the classic IRR vs NPV conflict, and NPV is always the correct tiebreaker
NPV vs IRR — When They Conflict
| Situation | Use IRR | Use NPV |
|---|---|---|
| Accept/reject single project | ✅ Quick screen vs hurdle rate | ✅ Confirms value creation |
| Compare two mutually exclusive projects | ⚠️ May mislead (scale ignored) | ✅ Always correct tiebreaker |
| Communicating returns to stakeholders | ✅ “18% IRR” is intuitive | ⚠️ Requires context on discount rate |
| Projects with different investment sizes | ❌ Misleads (big project may win) | ✅ Correct |
📌 Key rule: When IRR and NPV conflict, always trust NPV. IRR is a useful screening tool, but NPV measures actual rupee value created — which is ultimately what matters for building wealth.
📊 Explore Financial Calculators — Free
CAGR, SIP, compound interest, home loan EMI — all free on CalcDesk.
→ Explore All CalculatorsRelated Calculators & Articles
Discount Rate Selection — The Most Important Input
The discount rate is the single biggest assumption in any NPV calculation. Get it wrong, and your NPV analysis is worse than useless — it gives false precision to a flawed conclusion. Here is how to choose it correctly for different contexts.
How to Choose the Right Discount Rate
WACC = (Debt / Total Capital) × After-tax Debt Cost + (Equity / Total Capital) × Cost of Equity
For Personal Finance: Use Opportunity Cost
FD rate (7%) = risk-free baseline
Riskier project → add 2-5% risk premium
Equity alternative → use 10-12%
Rule of thumb: FD rate (7%) + project risk premium (0-5%) = discount rate
The risk-free rate in India today is approximately 7% (based on SBI FD rates for senior citizens). For a project of average business risk, add 3-5% to arrive at a discount rate of 10-12%. For high-risk ventures — new products, unproven markets — add 5-8%, giving a 12-15% hurdle rate. Only projects with positive NPV at the appropriate risk-adjusted rate should be accepted.
Sensitivity of NPV to Discount Rate — Same Project, Three Outcomes
Project: Annual cash inflows of ₹2,00,000 for 5 years. Initial investment: ₹7,00,000.
At 8% discount rate:
PV = ₹2L/1.08 + ₹2L/1.08² + ₹2L/1.08³ + ₹2L/1.08⁴ + ₹2L/1.08⁵ = ₹7,98,542
NPV = ₹7,98,542 − ₹7,00,000 = +₹98,542 → Accept
At 12% discount rate:
PV = ₹2L × annuity factor (5 yrs, 12%) = ₹2L × 3.6048 = ₹7,20,960
NPV = ₹7,20,960 − ₹7,00,000 = +₹20,960 → Marginal
At 15% discount rate:
PV = ₹2L × annuity factor (5 yrs, 15%) = ₹2L × 3.3522 = ₹6,70,440
NPV = ₹6,70,440 − ₹7,00,000 = −₹29,560 → Reject
The same project goes from clearly acceptable to clearly rejected simply by changing the discount rate from 8% to 15%. This is why the discount rate assumption is the most important — and most argued over — input in any NPV analysis.
The practical lesson: never present a single NPV figure as the answer. Always present NPV at three discount rates — conservative (lower), base case, and pessimistic (higher) — and let the decision-maker understand the range. A project that is robustly positive even at 15% is a strong investment. A project that flips negative at 12% is a borderline bet.
NPV of Buying vs Renting — Complete India Example
The rent vs buy decision is India’s most emotionally charged financial choice. NPV analysis cuts through the sentiment and reveals the actual economics. Here is a full worked example using Bengaluru market rates for FY 2026-27.
Scenario: 2BHK in Bengaluru worth ₹80 Lakh
Buying option:
Down payment: ₹20,00,000 | Home loan: ₹60,00,000 at 8.5% for 20 years
EMI = ₹52,149/month | Year 1 interest component = ₹5,04,000 | Year 1 principal = ₹1,21,788
Total annual cash outflow (buying): ₹52,149 × 12 = ₹6,25,788/year
Renting option:
Monthly rent for same 2BHK: ₹20,000 | Annual rent = ₹2,40,000/year
Invest the ₹20L down payment at 10% CAGR in equity mutual funds
₹20L grows to: ₹20L × (1.10)²⁰ = ₹1,34,55,000 (₹1.34 crore) in 20 years
Opportunity cost of extra EMI outflow vs rent:
Extra monthly cash outflow for buying vs renting: ₹52,149 − ₹20,000 = ₹32,149/month
This ₹32,149/month, if invested in SIP at 10% for 20 years, grows to approximately ₹24.4 lakh per year × growth factor — roughly ₹2.45 crore additional corpus
Property appreciation (buying):
At 6% CAGR: ₹80L property becomes ₹80L × (1.06)²⁰ = ₹2,56,47,000 (~₹2.57 crore) in 20 years
| Factor | Buying | Renting + Investing |
|---|---|---|
| 20-year property/corpus value | ₹2.57 crore (property) | ₹1.34Cr (down payment) + ₹2.45Cr (SIP) = ₹3.79 crore |
| Outstanding loan at year 20 | ~₹0 (fully repaid) | N/A |
| Total interest paid | ~₹65.4 lakh | Nil |
| Tax benefit (old regime, 30% bracket) | ₹2L interest deduction = ₹62,400/year saved | None on housing |
| Security/stability | High (own asset) | Lower (landlord risk) |
| Financial outcome | ₹2.57 crore asset | ₹3.79 crore portfolio |
The NPV analysis reveals that in a 6% appreciation city, renting and disciplined investing produces a significantly larger wealth outcome over 20 years. However, buying wins when: (a) the city appreciates faster than 7-8% annually (Mumbai 2003-2013, Bengaluru east corridor 2010-2020), (b) the renter lacks discipline in actually investing the EMI savings, or (c) there are qualitative factors like school proximity, stability, and renovation freedom that have real value not captured by NPV.
📌 Key insight for Indian buyers: In high-appreciation metro corridors (Bengaluru north/east, Hyderabad Gachibowli, Mumbai MMR), buying typically wins by year 12-14 on an NPV basis. In Tier-2 cities or slow-appreciation suburbs where property grows at only 4-5% CAGR, renting and investing in equity funds has consistently produced better outcomes over 15-20 year periods.
Frequently Asked Questions
NPV in Personal Finance — Home Buying Decision
NPV can quantify the rent vs buy decision that most Indians wrestle with:
Rent vs Buy — NPV Framework
Buy option: ₹80L property (₹20L down payment + ₹60L loan at 9% for 20 years)
Year 0 cash outflow: ₹20L down payment | Monthly EMI: ₹53,984 (~₹6.48L/year)
Year 20 inflow: Sell property at assumed ₹2 crore (5% CAGR appreciation)
Rent option: Rent same property for ₹25,000/month (₹3L/year)
Invest ₹20L down payment + ₹3.48L/year (EMI savings) in equity SIP at 12%
Year 20 portfolio value: ₹20L × (1.12)^20 + SIP corpus ≈ ₹1.93 crore + ₹85L = ₹2.78 crore
NPV comparison at 12% discount rate:
Buy NPV: PV of ₹2 crore at year 20 − PV of all EMIs − ₹20L down payment ≈ slightly negative to neutral
Rent NPV: ₹2.78 crore portfolio value > ₹2 crore property
Renting wins financially in this scenario — but buying provides housing security, emotional stability, and forced savings that NPV doesn’t capture
Sensitivity Analysis — NPV Under Different Assumptions
NPV is only as good as your assumptions. Always run sensitivity analysis with different discount rates and cash flow assumptions:
| Assumption | Optimistic | Base Case | Pessimistic |
|---|---|---|---|
| Property appreciation (CAGR) | 8% | 5% | 3% |
| Equity SIP return | 14% | 12% | 9% |
| NPV of renting (vs buying) | ₹1.2 crore better | ₹78L better | ₹12L worse (buying wins) |
The sensitivity table reveals: renting wins under most scenarios but buying wins if property appreciates at 8%+ while equity returns only 9%. This is the zone where Mumbai and Bangalore real estate historically operated in 2003-2010 — a genuine buy decision.
Payback Period — NPV’s Simpler Sibling
For quick investment screening, the payback period is often used alongside NPV:
Payback Period Formula
Simple: Rs.10L investment, Rs.3L/year inflow → Payback = 3.3 years
Limitation: Ignores time value of money and cash flows AFTER payback
Discounted Payback: Uses discounted cash flows — more accurate
Rule of thumb: Payback under 3 years = low risk
3-5 years = moderate risk
Above 7 years = high risk, high NPV required to justify
Payback period is particularly useful for small business decisions and equipment purchases where the time to recover your investment is intuitively meaningful. A restaurant owner evaluating a ₹5L kitchen upgrade that generates ₹1.2L additional monthly profit has a 4.2-month payback period — obviously proceed. NPV adds precision; payback adds intuition.
NPV in SIP Goal Planning
You can use NPV logic to verify your SIP goal planning:
Is my SIP on track? — NPV check
Goal: ₹50 lakh in 10 years for child’s education
Current SIP: ₹10,000/month | Assumed return: 12% CAGR
Future value of SIP: ₹10,000 × [(1.01)^120 − 1] / 0.01 × 1.01 ≈ ₹23.2L
NPV of goal: ₹50L / (1.12)^10 = ₹16.1L (present value of the goal amount)
Present value of planned SIP: ₹23.2L / (1.12)^10 ≈ ₹7.5L — significantly below ₹16.1L target PV
Conclusion: Need to increase SIP to approximately ₹21,500/month to have an NPV matching the goal