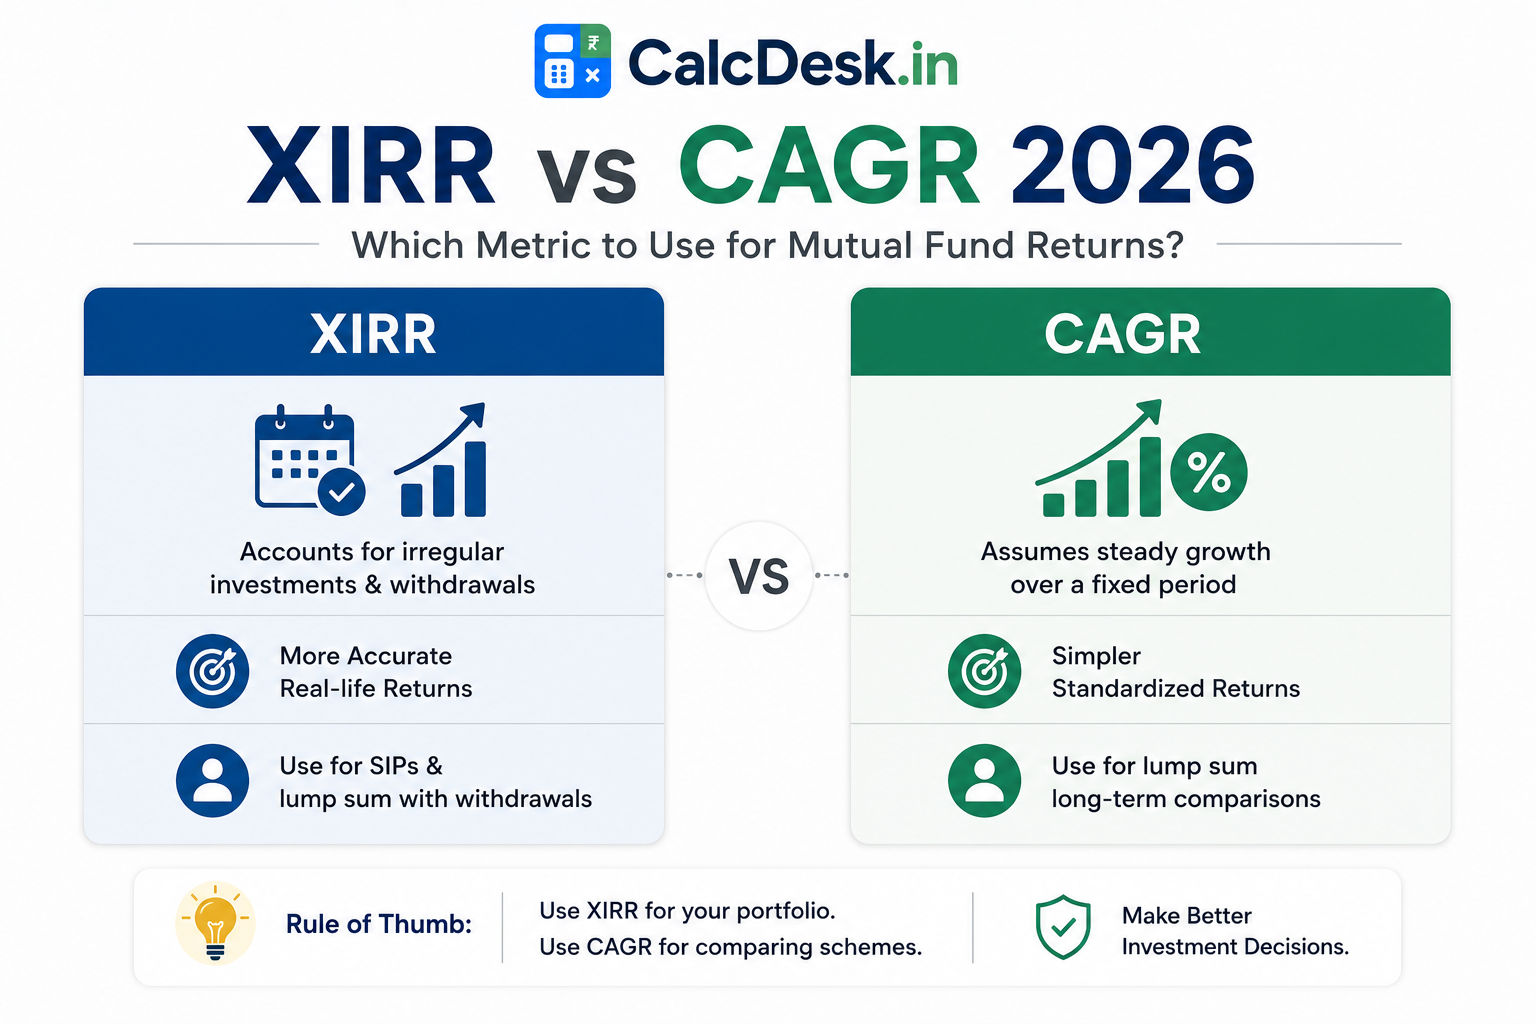
XIRR vs CAGR — Which Metric Accurately Measures Your Returns?
If you’ve looked at your mutual fund portfolio on Groww, Zerodha Coin, or any AMC app, you’ve seen two metrics: CAGR and XIRR. Many investors use them interchangeably — which is a significant error. CAGR is only accurate for lump-sum investments. XIRR is the correct metric for SIP portfolios with multiple cash flows. Using the wrong metric can make your investments appear to perform better or worse than they actually do, leading to flawed decisions.
This guide explains exactly what each metric measures, when each is correct, how to calculate XIRR in Excel, and worked examples comparing both. Use CalcDesk’s CAGR Calculator for lump-sum investments.
Core Difference — One Formula vs Many Cash Flows
| Feature | CAGR | XIRR |
|---|---|---|
| Full Name | Compound Annual Growth Rate | Extended Internal Rate of Return |
| Cash Flows | Single investment, single exit | Multiple investments at different dates |
| Best For | Lump-sum investments | SIP portfolios, irregular investments |
| Formula | (End/Begin)^(1/n) − 1 | Solves NPV=0 iteratively |
| Accuracy for SIPs | Approximate only | Exact annualised return |
| Where you see it | Mutual fund factsheets | Personal portfolio apps |
When to Use Each
- Use CAGR when: You made a single lump-sum on one date and want the annualised return to today’s value
- Use XIRR when: You’ve made multiple investments over time — monthly SIPs, quarterly top-ups, irregular purchases, or partial redemptions
- Mutual fund factsheets: “5-year return: 14.2%” assumes lump-sum invested 5 years ago — that’s CAGR
- Your personal SIP portfolio: Should always be measured using XIRR — shown automatically on Groww, Zerodha, Kuvera
Worked Example 1 — CAGR for Lump Sum (Correct Use)
₹2,00,000 lump sum on 1 April 2020, value ₹3,89,000 on 31 March 2026
CAGR = (3,89,000 / 2,00,000)^(1/5) − 1 = (1.945)^(0.2) − 1 = 14.2% per annum
This is accurate — one investment in, one value out, five years apart.
Worked Example 2 — Why CAGR Fails for SIP
₹10,000/month SIP for 3 years, current value ₹4,60,000
Total invested: ₹3,60,000 | Gain: ₹1,00,000
Naive CAGR approach (wrong): (4,60,000/3,60,000)^(1/3) − 1 = 8.5%
This treats all ₹3,60,000 as if invested 3 years ago — but the last ₹10,000 was invested just 1 month ago.
XIRR (correct): Approximately 15–16%
XIRR weights each instalment by how long it was actually invested and finds the single rate that explains the entire cash flow pattern. The early instalments had 3 years to grow; the last instalment had 1 month — XIRR accounts for all of this.
Worked Example 3 — Comparing Two Portfolios
Investor A (lump sum) vs Investor B (SIP), same fund
Investor A: ₹5,00,000 lump sum on 1 April 2020. Value today: ₹9,72,500.
CAGR = (9,72,500/5,00,000)^(0.2) − 1 = 14.2%
Investor B: ₹10,000/month SIP since April 2020 (60 instalments). Total invested: ₹6,00,000. Value today: ₹9,50,000.
XIRR ≈ 17.5% (because early SIP instalments had 5 years to grow, boosting the annualised rate)
Investor A’s CAGR and Investor B’s XIRR are not comparable — they measure different investment patterns in the same fund.
How to Calculate XIRR in Excel / Google Sheets
XIRR in Excel — Step by Step
Column B: Corresponding dates (actual calendar dates)
Example:
A1: -10000 B1: 01-04-2022
A2: -10000 B2: 01-05-2022
… (36 rows for 3-year SIP)
A37: +460000 B37: 01-04-2026 (today’s portfolio value)
Formula: =XIRR(A1:A37, B1:B37)
Result: Your exact annualised SIP return
Common XIRR vs CAGR Mistakes
- “My SIP returned 15% CAGR”: Incorrect phrasing — SIP returns should be called XIRR. CAGR of an SIP is undefined without specifying which instalment’s entry date you’re using
- Comparing XIRR to benchmark CAGR: A fund’s “5-year CAGR 14%” assumes lump-sum at start. Your SIP XIRR of 17% on the same fund doesn’t mean you beat the fund — your higher XIRR is partly because later instalments had less time and the market may have risen recently
- XIRR changes daily: Since XIRR is sensitive to current portfolio value, it changes every day with market movements. CAGR for lump-sum also changes daily but more gradually
📌 Bottom line: For evaluating your SIP portfolio, trust the XIRR shown on your investment platform — it’s the accurate figure. For comparing mutual funds against each other or benchmarks, use the fund factsheet’s point-to-point CAGR. Never directly compare your XIRR to a fund’s CAGR without understanding what each measures.
📊 Calculate CAGR for Lump-Sum — Free
Enter beginning value, ending value, and years. Instant CAGR result.
→ Open CAGR CalculatorRelated Calculators & Articles
XIRR of Your Entire Portfolio — Not Just One Fund
Most investors track XIRR fund-by-fund, but the more meaningful number is your portfolio-level XIRR — the single annualised return that accounts for every rupee you’ve invested across all funds, at every date. This tells you whether your overall investing strategy is working, not just whether a specific fund performed.
How to Build a Portfolio-Level XIRR in Excel — 3-Fund Example
Fund A: ₹5,000/month SIP for 3 years (36 entries from April 2022 to March 2026, each −₹5,000)
Fund B: ₹1,00,000 lump sum on 1 April 2023 (one entry: −₹1,00,000)
Fund C: ₹3,000/month SIP for 1 year (12 entries from April 2024 to March 2026, each −₹3,000)
Step 1: Create one Excel sheet. Column A = cash flows, Column B = dates. Enter every SIP installment as a negative value with the exact SIP date.
Step 2: Total invested: ₹36 × ₹5,000 = ₹1,80,000 (Fund A) + ₹1,00,000 (Fund B) + ₹12 × ₹3,000 = ₹36,000 (Fund C) = ₹3,16,000 total outflows.
Step 3: Check today’s value on each platform. Say Fund A = ₹2,05,000, Fund B = ₹1,18,000, Fund C = ₹38,500. Total current value = ₹3,61,500.
Step 4: Add one positive entry: ₹3,61,500 with today’s date (6 July 2026) as the final row.
Step 5: Formula: =XIRR(A1:A50, B1:B50) — covers all 36 + 1 + 12 + 1 entries.
Result: Portfolio XIRR ≈ 11.5% means your blended return across all three funds and all investment dates is 11.5% annualised.
💡 Benchmark comparison: Run the same XIRR exercise for Nifty 50 Total Return Index using the same investment dates and amounts. Historical Nifty TRI data is available on the NSE website. If your portfolio XIRR is 11.5% and Nifty TRI XIRR for the same dates is 13.2%, active fund selection actually reduced your return. If yours is higher, active management added value. This is the only intellectually honest way to compare yourself to a benchmark when investing through SIPs. Common error to avoid: older funds that pay dividends — include reinvested dividend amounts as negative cash flows on the dividend date, or switch to growth plan to eliminate this complication entirely.
CAGR vs Absolute Return vs TWRR — Complete Hierarchy
Four different return metrics exist in investing, and each answers a different question. Using the wrong one leads to incorrect conclusions about performance.
| Metric | Formula | Best Used For | Limitation |
|---|---|---|---|
| Absolute Return | (End − Start) / Start × 100 | Investments under 1 year | Doesn’t annualise; 12% over 8 months looks same as 12% over 8 years |
| CAGR | (End/Start)^(1/years) − 1 | Lump sum over multiple years | Assumes single entry/exit; fails for multiple cash flows |
| XIRR | Solves NPV = 0 iteratively | SIPs, irregular flows, partial withdrawals | Sensitive to current market value; changes daily |
| TWRR | Links sub-period returns, removes cash flow effect | Fund manager performance measurement | Requires daily NAV data; not practical for individual investors |
Same Investment, Four Different Numbers
Scenario: ₹5,000/month SIP for 5 years (60 months). Total invested: ₹3,00,000. Current value: ₹4,20,000.
Absolute Return: (₹4,20,000 − ₹3,00,000) / ₹3,00,000 × 100 = 40%. Accurate but meaningless without time dimension.
“CAGR” (incorrectly applied): Many investors calculate 40%/5 = 8% per year. This is wrong — it’s not how CAGR works, and it ignores that not all ₹3L was invested for 5 years.
CAGR (applied correctly, but still wrong for SIP): (₹4,20,000 / ₹3,00,000)^(1/5) − 1 = 6.96%. Slightly better calculation, but still assumes all ₹3L was invested on Day 1 — which it wasn’t.
XIRR (correct): ≈ 14.8%. Because the first ₹5,000 had 60 months to grow while the last ₹5,000 had only 1 month — XIRR correctly accounts for each installment’s actual time in the market. The annualised rate needed to explain the entire cash flow pattern is 14.8%.
Which to use when: Measuring your SIP return → XIRR. Comparing two lump sum options → CAGR. Fund’s return on a factsheet → CAGR (standardised, assumes lump sum at period start). Your portfolio’s overall performance → portfolio-level XIRR.
Frequently Asked Questions
XIRR in Practice — Common Platform Displays
Understanding how different platforms display XIRR vs CAGR helps you interpret your portfolio correctly:
| Platform / Document | Metric Shown | What It Means |
|---|---|---|
| Groww / Zerodha Coin (SIP portfolio) | XIRR | True annualised return on your specific investment dates |
| Kuvera / Paytm Money | XIRR | Same — accounts for each SIP instalment date |
| Mutual Fund Factsheet | CAGR (1yr, 3yr, 5yr) | Point-to-point lump-sum return for the specified period |
| AMC Website — “Returns” tab | CAGR | Assumes lump-sum invested on start date of period |
| Moneycontrol / ValueResearch | CAGR (historical) | Past performance of fund, not your personal return |
| NPS CRA Statement | XIRR (for SIP) / CAGR (for lump sum) | Mix depending on how you invested |
Why XIRR Feels Higher Than Expected — The Math
Many investors are surprised that their XIRR is higher than the fund’s stated CAGR over the same period. Here’s the mathematical reason:
In an SIP, earlier instalments have more time to compound. If markets rose over your investment period, your earliest instalments (which had the most time) grew the most. The XIRR formula must find a single rate that explains all this time-differentiated growth — and that rate ends up higher than the simple CAGR for the period, because the CAGR treats all money as if invested on the same starting date.
Numerical Illustration
₹10,000/month SIP for 36 months in a fund that delivered flat 12% CAGR (lump-sum basis)
First instalment: grew at 12% for 36 months = ₹14,185
Last instalment: grew at 12% for 1 month = ₹10,095
Average effective growth per rupee invested: higher than 12% CAGR because the dollar-weighted (XIRR) calculation gives more weight to the early instalments that had more time
XIRR for this exact scenario: approximately 13.5-14% — even though the fund’s CAGR was 12%
This is not outperformance — it’s the mathematical effect of SIP timing