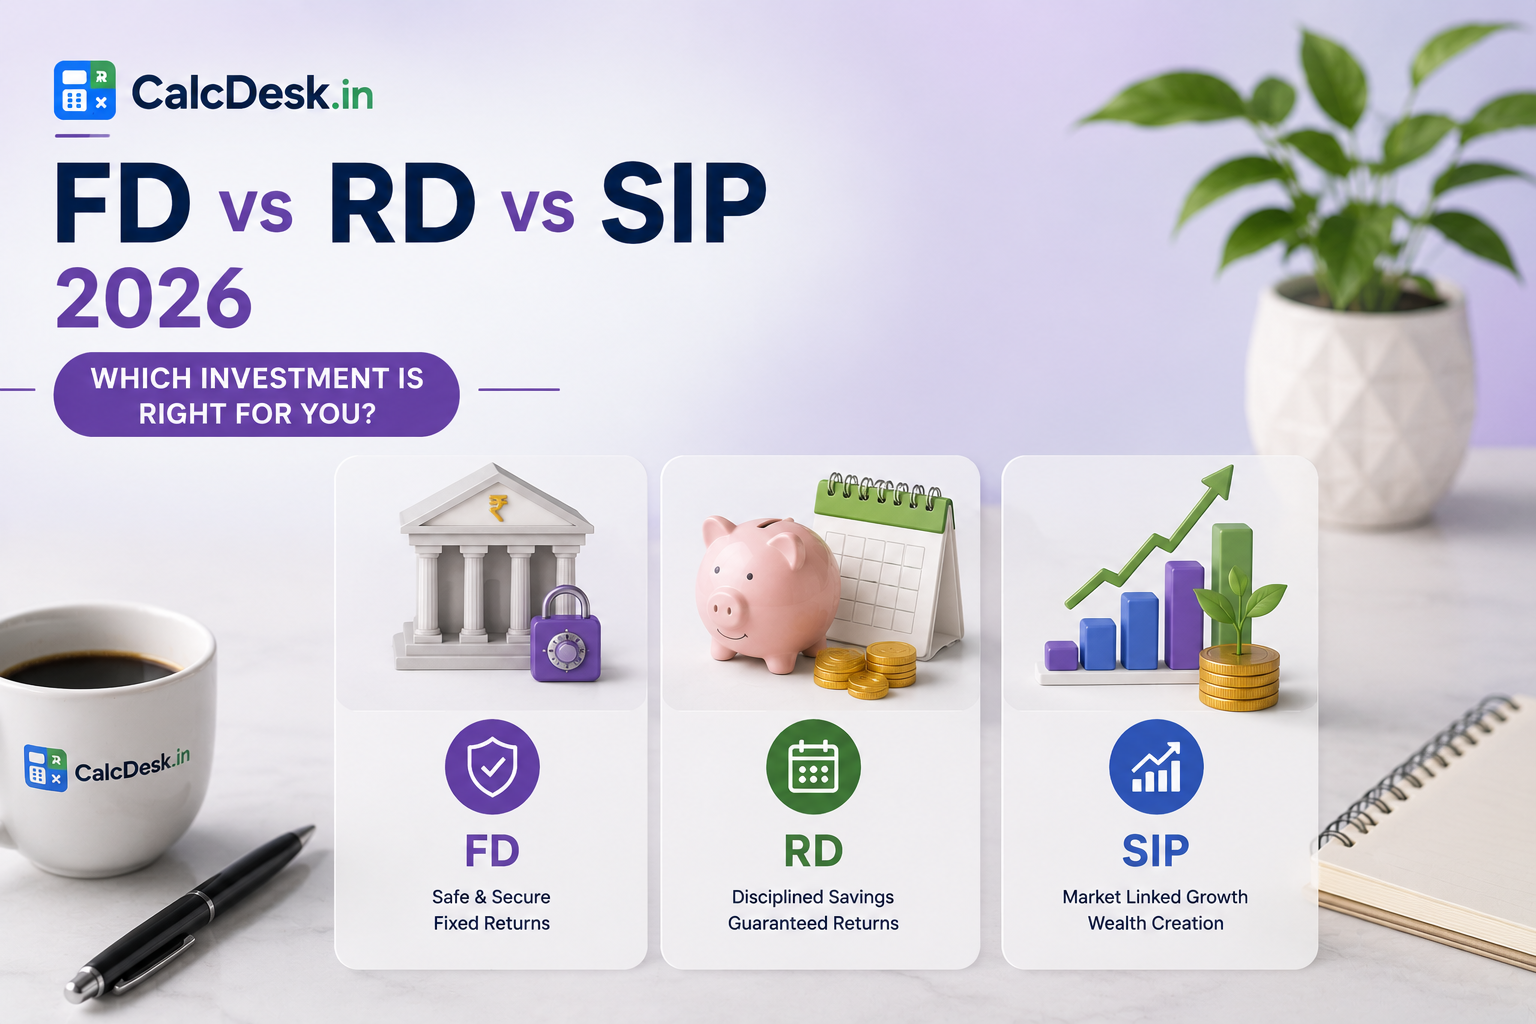
FD vs RD vs SIP 2025 — Which Investment is Right for You?
Every Indian saver eventually faces this question: should I park my money in a Fixed Deposit, build discipline through a Recurring Deposit, or take the equity route through SIP mutual funds? Each serves a fundamentally different purpose — FD for safety, RD for disciplined saving with guaranteed returns, and SIP for long-term wealth creation with market-linked growth. Choosing the wrong vehicle for your goal’s timeline is one of the most common — and costly — financial planning mistakes.
This guide compares FD, RD, and SIP across returns, risk, liquidity, and tax treatment, with worked examples to help you match the right instrument to your goal. Use CalcDesk’s SIP Calculator and Compound Interest Calculator for FD/RD projections.
FD vs RD vs SIP — Core Comparison
| Feature | Fixed Deposit (FD) | Recurring Deposit (RD) | SIP (Equity Mutual Fund) |
|---|---|---|---|
| Investment Style | One-time lump sum | Fixed monthly deposit | Fixed monthly investment |
| Returns | 6.5-7.5% (guaranteed) | 6.5-7.5% (guaranteed) | 10-15% CAGR (historical, market-linked) |
| Risk | Very low (DICGC insured to ₹5L) | Very low | Moderate to high (market risk) |
| Liquidity | Premature withdrawal with penalty | Premature withdrawal with penalty | High (redeem anytime, exit load may apply) |
| Tax on Returns | As per income slab | As per income slab | LTCG 12.5% above ₹1.25L/year |
| Minimum Investment | Varies (₹1,000-10,000) | ₹100-500/month | ₹100-500/month |
| Best Horizon | Short-term (under 3 years) | Short-medium term (1-5 years) | Long-term (5+ years) |
Worked Example 1 — ₹5 Lakh Lump Sum: FD vs SIP-equivalent Lumpsum
₹5 lakh invested for 10 years
FD at 7%: ₹5,00,000 × (1.07)^10 = ₹9,83,576
Interest earned: ₹4,83,576 (fully taxable as per slab)
Equity Mutual Fund Lump Sum at 12%: ₹5,00,000 × (1.12)^10 = ₹15,53,000
Gain: ₹10,53,000 (taxed at 12.5% LTCG above ₹1.25L exemption per year)
Difference: ₹5,69,424 more from equity investment — but with market risk that FD does not carry
Worked Example 2 — ₹10,000/Month: RD vs SIP
10-year comparison of monthly investment
RD at 7%: ≈ ₹17,40,000 (total invested: ₹12,00,000, interest: ₹5,40,000)
SIP at 12%: ≈ ₹23,23,000 (total invested: ₹12,00,000, gain: ₹11,23,000)
SIP advantage: ₹5,83,000 more over 10 years — at the cost of market volatility, which RD does not have
Worked Example 3 — Short-Term Goal (2 Years): Why FD Wins Here
Saving ₹3 lakh for a wedding in 2 years
FD at 7%, 2 years: ₹3,00,000 × (1.07)^2 = ₹3,43,470 — guaranteed
SIP at assumed 12%, 2 years: Could range from ₹2,70,000 (if market falls 15%) to ₹3,80,000 (if market rises well) — uncertain
For a fixed near-term need, the certainty of FD outweighs the higher expected (but uncertain) return of equity SIP
Risk and Volatility — The Real Trade-off
📌 Why SIP risk matters for timing: Equity markets can fall 20-30% in a bad year. If you need your money within 1-3 years and the market is down at that exact time, you may be forced to sell at a loss. Over 7-10+ year periods, this risk diminishes significantly as markets historically recover and grow, but short-term SIP investments carry real risk that FD/RD simply don’t have.
Tax Treatment — Where SIP Has the Edge
| Investment | Tax on Returns | TDS |
|---|---|---|
| FD Interest | As per income tax slab (5%/20%/30%) | 10% if interest > ₹40,000/year |
| RD Interest | As per income tax slab | 10% if interest > ₹40,000/year |
| SIP (Equity, >1 yr) | LTCG 12.5% above ₹1.25L/year exemption | None (self-assessed) |
| SIP (Equity, <1 yr) | STCG 20% | None (self-assessed) |
For someone in the 30% tax bracket, FD interest is taxed at the full 30% rate, while SIP equity gains enjoy a much lower 12.5% rate with a ₹1.25 lakh annual exemption — making SIP significantly more tax-efficient for high earners over long horizons.
When to Use Each Instrument
- Use FD for: Emergency fund, near-term goals (under 2 years), capital preservation, senior citizens needing guaranteed income
- Use RD for: Disciplined monthly saving toward a medium-term goal (vacation, gadget purchase, vehicle down payment) where guaranteed returns matter
- Use SIP for: Long-term wealth creation (5+ years), retirement planning, children’s education fund, building wealth that beats inflation meaningfully
Read the detailed SIP vs Lump Sum guide and FD vs Debt Mutual Fund comparison for more nuanced investment decisions.
💡 Tip: Most financial planners recommend a “barbell” approach: keep 6 months of expenses in FD/liquid funds for emergencies, and direct all long-term surplus into SIP. Avoid the common mistake of keeping large sums in FD for 10+ year goals — inflation (typically 5-6%) erodes much of the FD’s real return advantage over equity in the long run.
📈 Calculate and Compare Your Returns — Free
Project your FD, RD, or SIP growth for any amount, rate, and time period.
→ Open SIP CalculatorPost-Tax Returns at FY 2026-27 Rates — Actual Numbers
The headline interest rate on an FD or RD is not what you actually earn — your effective yield depends on your income tax slab. At the 30% slab, a 7.5% FD gives you a post-tax return of only 5.25%, which barely keeps pace with retail inflation. Here is the full picture across slabs for FY 2026-27:
| Instrument & Rate | Pre-tax Return | Post-tax at 10% slab | Post-tax at 20% slab | Post-tax at 30% slab |
|---|---|---|---|---|
| FD at 7.0% | 7.00% | 6.30% | 5.60% | 4.90% |
| FD at 7.5% | 7.50% | 6.75% | 6.00% | 5.25% |
| RD at 7.0% | 7.00% | 6.30% | 5.60% | 4.90% |
| RD at 7.5% | 7.50% | 6.75% | 6.00% | 5.25% |
| SIP Equity at 12% CAGR (LTCG, gains >₹1.25L) | 12.00% | ~11.5%* | ~11.5%* | ~11.5%* |
*SIP equity LTCG is taxed at a flat 12.5% regardless of income slab, only on gains exceeding ₹1.25 lakh per year. For a systematic investor with moderate corpus, annual gains often stay within or near the ₹1.25 lakh exemption in early years, making effective tax even lower. The table above is a planning approximation — actual LTCG depends on redemption timing and gain amount.
Post-Tax Return Comparison — 30% Slab Investor, ₹10,000/month for 10 Years
RD at 7.5% (pre-tax): Maturity value ≈ ₹17.9 lakh. Interest earned ≈ ₹5.9 lakh. Tax at 30% = ₹1.77 lakh. Net corpus after tax: ≈ ₹16.13 lakh.
SIP in equity fund at 12% CAGR: Maturity value ≈ ₹23.23 lakh. Gain ≈ ₹11.23 lakh. LTCG tax at 12.5% (on gain above ₹1.25L exemption) ≈ ₹1.25 lakh (approximate, spread over redemption). Net corpus after tax: ≈ ₹21.98 lakh.
Difference in hand: ₹21.98L − ₹16.13L = ₹5.85 lakh more from SIP after accounting for respective taxes. This is the real advantage that tax treatment creates — not just the headline rate difference.
Note: SIP returns are market-linked and 12% is a planning assumption based on historical large-cap equity returns over 10+ years. Actual returns may be higher or lower. RD returns are guaranteed.
DICGC Insurance — What’s Protected When a Bank Fails
Most depositors assume their entire bank balance is safe regardless of the amount. The reality is more nuanced — and the distinction matters significantly if you hold large FD or RD balances.
DICGC coverage: The Deposit Insurance and Credit Guarantee Corporation (DICGC), a wholly owned subsidiary of the Reserve Bank of India, provides deposit insurance of up to ₹5 lakh per depositor per bank. This ₹5 lakh limit was increased from ₹1 lakh in February 2020 following the PMC Bank crisis.
What is covered: All deposits held in the same bank — savings accounts, current accounts, Fixed Deposits, Recurring Deposits, and NRE/NRO deposits — are aggregated, and the combined amount up to ₹5 lakh is insured. This means if you have ₹3 lakh in FDs and ₹2 lakh in savings in the same bank, your total coverage is exactly ₹5 lakh — which happens to cover everything. But if you have ₹8 lakh in FDs in the same bank, only ₹5 lakh is insured and the remaining ₹3 lakh is at risk in a bank failure scenario.
What is NOT covered: Mutual fund investments made through a bank’s platform (such as an FD-linked MF), stocks, bonds, government securities, and any instrument that is not a bank deposit. DICGC covers only bank deposits — not investment products.
Recent examples: During the PMC Bank (Punjab and Maharashtra Co-operative Bank) crisis in 2019-20 and the Yes Bank moratorium in 2020, depositors with amounts up to ₹5 lakh (under the revised limit) were fully protected. The RBI-managed reconstruction of Yes Bank eventually restored full access to all deposits, but the PMC Bank case demonstrated that the ₹5L cap was the guaranteed floor even in a worst case.
Practical implication for large FD holders: If you have more than ₹5 lakh parked in FDs, spread it across multiple banks rather than concentrating in a single bank. ₹20 lakh in FDs distributed across 4 banks gives ₹5 lakh of DICGC coverage at each bank — full protection. ₹20 lakh in a single bank gives ₹5 lakh coverage and ₹15 lakh at risk. This applies to FDs and RDs equally. For cooperative banks and small finance banks (which carry slightly higher risk than nationalised banks), staying within the ₹5 lakh per bank limit is especially important.
Sweep-in FD — Earn FD Returns While Keeping Savings Account Flexibility
One of the most underused banking features in India, the sweep-in FD (also called auto-sweep or flexi-deposit) gives you FD-level returns on idle money without sacrificing liquidity.
How sweep-in FD works: You set a threshold balance for your savings account (typically ₹10,000 to ₹25,000 depending on the bank). When your savings account balance exceeds this threshold, the bank automatically “sweeps” the excess amount into an FD earning the full FD rate (currently 6.5-7.5% depending on the bank and tenure). When you need money and your savings account balance falls below the threshold, the bank automatically breaks the smallest or most recent FD first (LIFO — Last In First Out) and credits the funds back to your savings account. There is no manual action required.
Why this matters: A typical savings account earns 3-4% interest. Money that sits idle in savings between salary credit and expense payments is earning below-inflation returns. Sweep-in automatically upgrades that idle money to FD rates (6.5-7.5%) without any loss of accessibility. The difference of 3-4% on even ₹1 lakh idle for 6 months adds up to ₹1,500-2,000 in additional interest with zero effort.
Banks offering sweep-in FD: SBI (Multi-Option Deposit Scheme / MOD), HDFC Bank (SweepIn account), ICICI Bank (Money Multiplier), Axis Bank (24×7 FD), Kotak Mahindra Bank (ActivMoney). Minimum sweep amount is typically ₹1,000 per sweep, and the default FD tenure is usually 1 year, earning the 1-year FD rate. Check your bank’s specific terms as the threshold amounts and sweep mechanics vary slightly.
Tax note: Interest earned on sweep-in FDs is taxable just like regular FD interest, aggregated with your total FD interest for the year for TDS purposes.
Small Finance Bank FDs — Higher Returns, What’s the Risk?
Small Finance Banks (SFBs) consistently offer FD rates 50-150 basis points higher than major nationalised and private sector banks. For yield-seeking investors in the fixed income space, this premium is significant. Here is the current landscape and the risk framework to evaluate it properly.
Current FD rates at Small Finance Banks (FY 2026-27):
AU Small Finance Bank: 8.00-8.50% for select tenures | ESAF Small Finance Bank: 8.25-8.75% | Suryoday Small Finance Bank: 8.50-9.00% | Unity Small Finance Bank: up to 9.00% for select tenures | Ujjivan Small Finance Bank: 7.75-8.25%
Are SFB FDs safe? Yes — with a caveat on amount. Small Finance Banks are licensed and regulated by the Reserve Bank of India, subject to the same CRR, SLR, and prudential norms as other scheduled commercial banks. Critically, all SFB deposits are covered by DICGC insurance up to ₹5 lakh per depositor — the same guarantee as SBI or HDFC Bank. Below ₹5 lakh, an SFB FD carries the same government-backed deposit insurance as any major bank.
Credit rating check: Before depositing above the ₹5 lakh insured limit, verify the SFB’s credit rating from CRISIL or ICRA. Prefer banks rated A or above for their fixed deposit programs. AU Small Finance Bank, for instance, carries strong ratings reflecting a well-diversified loan book. Smaller or newer SFBs may have lower ratings reflecting their more concentrated portfolios.
Recommended allocation strategy: Limit SFB FD exposure to 25-30% of your total fixed income portfolio. If your total FD corpus is ₹20 lakh, allocate ₹5-6 lakh to SFBs (preferably split across 2 SFBs within the ₹5 lakh DICGC limit each), and park the balance in nationalised bank FDs or government savings schemes (SSY, PPF, SCSS as applicable). This gives you the yield benefit from SFBs without excessive concentration risk.